Analysis of the Buy Entry: 2350/52
This level has been chosen as a potential long entry point due to a confluence of several technical factors.
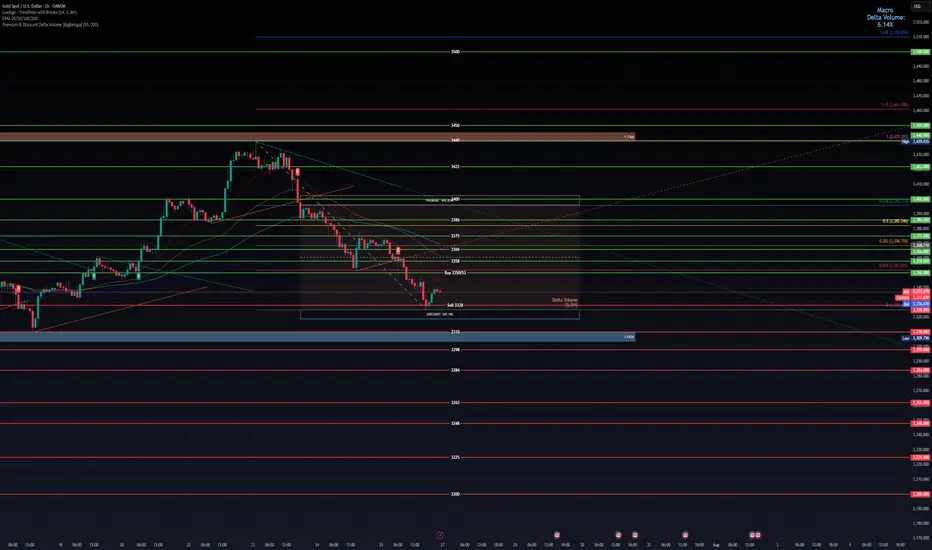
Smart Money Concepts (SMC) - Discount Zone: The chart has a "Premium - Discount" range drawn over the recent downward price leg. The equilibrium (EQ) level is marked in the middle. According to SMC principles, traders look to buy assets at a "discount" (below the 50% EQ level) and sell at a "premium" (above the EQ level). Your buy entry at 2350/52 is located deep within the discount zone, making it an attractive price from this perspective.
Key Horizontal Support Level: The 2350 price is a significant psychological and technical level. Looking to the left of the chart, this area has previously acted as both support and resistance. By placing a buy order here, you are anticipating that this historical support level will hold again and cause price to bounce.
Potential Mean Reversion: At the point of entry, the price is significantly extended below the moving averages (the thin red, orange, and green lines). This can sometimes indicate an "oversold" condition in the short term, increasing the probability of a corrective bounce back up towards the moving averages (the "mean").
In summary, the buy entry is a calculated risk, betting on a bounce from a confluence of a deep discount price, a strong historical support level, and an oversold condition.
Analysis of the Sell Level: 2328
This level is critically important and likely serves two potential purposes: as a stop-loss for the buy trade, or as a trigger for a new short (sell) position.
Breakdown of Major Support: The chart highlights a significant support zone (the thick blue/grey box) roughly between 2330 and 2334. Your sell level at 2328 is placed just below this entire support structure and also below the most recent swing low. A price break below 2328 would signify a failure of this support, confirming that sellers are still in firm control.
Confirmation of Bearish Trend Continuation: In a downtrend, the price makes a series of lower highs and lower lows. A move down to 2328 would create a new lower low, reinforcing the bearish market structure and suggesting that the price is likely to continue much lower. This makes it an ideal place to exit a long position (cut losses) or to initiate a new short position to follow the dominant trend.
Order Flow and Volume Clues:
The note "Delta Volume?" next to this level suggests you are looking for confirmation from order flow data. A strong negative delta (more aggressive sellers than buyers) as the price breaks 2328 would provide strong confirmation for a short trade.
The label "LVN [low] 2334.86" indicates a Low-Volume Node from a volume profile analysis. Price tends to move very quickly through these areas of low liquidity. By placing the sell level below the LVN and the support zone, you are anticipating an acceleration or a "flush" downwards once these key levels are breached.
In summary, the 2328 level is the invalidation point for the bullish "bounce" idea. If the price reaches this level, the reasons for buying are no longer valid, and the evidence strongly points towards a continuation of the downtrend.
Overall Strategy
The plan is to:
Enter a counter-trend long at 2350/52, anticipating a bounce from a strong support and discount zone.
Define risk by placing a stop-loss just below the key support structure at 2328.
Potentially use the 2328 level as a trigger to close the long and open a new short position to trade with the dominant bearish trend if the support level fails.
This level has been chosen as a potential long entry point due to a confluence of several technical factors.
Smart Money Concepts (SMC) - Discount Zone: The chart has a "Premium - Discount" range drawn over the recent downward price leg. The equilibrium (EQ) level is marked in the middle. According to SMC principles, traders look to buy assets at a "discount" (below the 50% EQ level) and sell at a "premium" (above the EQ level). Your buy entry at 2350/52 is located deep within the discount zone, making it an attractive price from this perspective.
Key Horizontal Support Level: The 2350 price is a significant psychological and technical level. Looking to the left of the chart, this area has previously acted as both support and resistance. By placing a buy order here, you are anticipating that this historical support level will hold again and cause price to bounce.
Potential Mean Reversion: At the point of entry, the price is significantly extended below the moving averages (the thin red, orange, and green lines). This can sometimes indicate an "oversold" condition in the short term, increasing the probability of a corrective bounce back up towards the moving averages (the "mean").
In summary, the buy entry is a calculated risk, betting on a bounce from a confluence of a deep discount price, a strong historical support level, and an oversold condition.
Analysis of the Sell Level: 2328
This level is critically important and likely serves two potential purposes: as a stop-loss for the buy trade, or as a trigger for a new short (sell) position.
Breakdown of Major Support: The chart highlights a significant support zone (the thick blue/grey box) roughly between 2330 and 2334. Your sell level at 2328 is placed just below this entire support structure and also below the most recent swing low. A price break below 2328 would signify a failure of this support, confirming that sellers are still in firm control.
Confirmation of Bearish Trend Continuation: In a downtrend, the price makes a series of lower highs and lower lows. A move down to 2328 would create a new lower low, reinforcing the bearish market structure and suggesting that the price is likely to continue much lower. This makes it an ideal place to exit a long position (cut losses) or to initiate a new short position to follow the dominant trend.
Order Flow and Volume Clues:
The note "Delta Volume?" next to this level suggests you are looking for confirmation from order flow data. A strong negative delta (more aggressive sellers than buyers) as the price breaks 2328 would provide strong confirmation for a short trade.
The label "LVN [low] 2334.86" indicates a Low-Volume Node from a volume profile analysis. Price tends to move very quickly through these areas of low liquidity. By placing the sell level below the LVN and the support zone, you are anticipating an acceleration or a "flush" downwards once these key levels are breached.
In summary, the 2328 level is the invalidation point for the bullish "bounce" idea. If the price reaches this level, the reasons for buying are no longer valid, and the evidence strongly points towards a continuation of the downtrend.
Overall Strategy
The plan is to:
Enter a counter-trend long at 2350/52, anticipating a bounce from a strong support and discount zone.
Define risk by placing a stop-loss just below the key support structure at 2328.
Potentially use the 2328 level as a trigger to close the long and open a new short position to trade with the dominant bearish trend if the support level fails.
Trade ativo
Sell from 2328 running 263 pipsAviso legal
As informações e publicações não devem ser e não constituem conselhos ou recomendações financeiras, de investimento, de negociação ou de qualquer outro tipo, fornecidas ou endossadas pela TradingView. Leia mais em Termos de uso.
Aviso legal
As informações e publicações não devem ser e não constituem conselhos ou recomendações financeiras, de investimento, de negociação ou de qualquer outro tipo, fornecidas ou endossadas pela TradingView. Leia mais em Termos de uso.