This trading plan combines Elliott Wave analysis with Fibonacci retracement and extension levels, focusing on key psychological points to guide entry, exit, and risk management decisions for the Gold/USD 1-hour chart.
Fibonacci Levels & Psychological Zones:
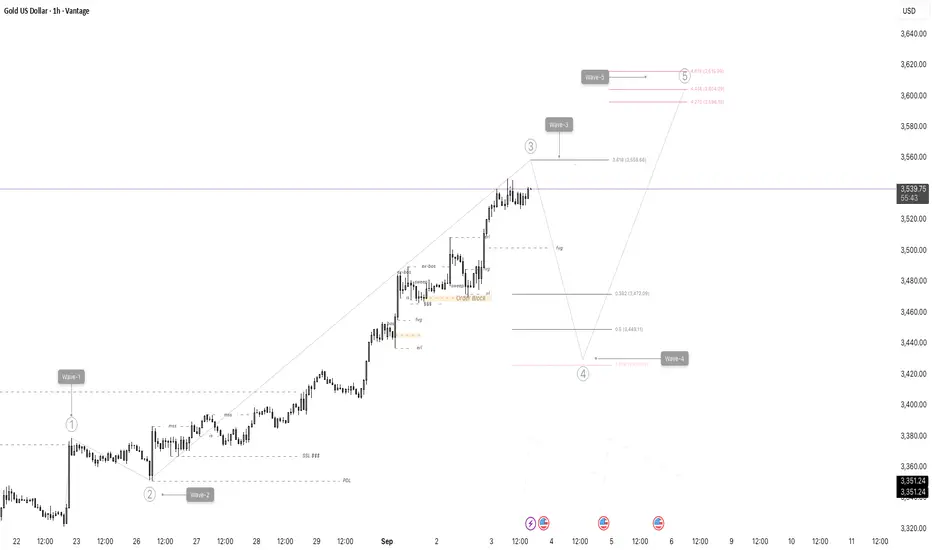
Wave 3 is approaching a Fibonacci extension zone near 3,558 - 3,616 (from 3.618 to 4.618 levels). This acts as a key resistance and potential Wave 3 target.
The retracement for Wave 4 correction is expected to land within the important Fibonacci retracement zones:
- 38.2% (~3,472)
- 50% (~3,449)
- 61.8% (~3,426)
These Fibonacci levels serve as psychological support zones where Wave 4 could end and Wave 5 might begin.
Fibonacci Levels & Psychological Zones:
Wave 3 is approaching a Fibonacci extension zone near 3,558 - 3,616 (from 3.618 to 4.618 levels). This acts as a key resistance and potential Wave 3 target.
The retracement for Wave 4 correction is expected to land within the important Fibonacci retracement zones:
- 38.2% (~3,472)
- 50% (~3,449)
- 61.8% (~3,426)
These Fibonacci levels serve as psychological support zones where Wave 4 could end and Wave 5 might begin.
Publicações relacionadas
Aviso legal
As informações e publicações não devem ser e não constituem conselhos ou recomendações financeiras, de investimento, de negociação ou de qualquer outro tipo, fornecidas ou endossadas pela TradingView. Leia mais em Termos de uso.
Publicações relacionadas
Aviso legal
As informações e publicações não devem ser e não constituem conselhos ou recomendações financeiras, de investimento, de negociação ou de qualquer outro tipo, fornecidas ou endossadas pela TradingView. Leia mais em Termos de uso.