Summary
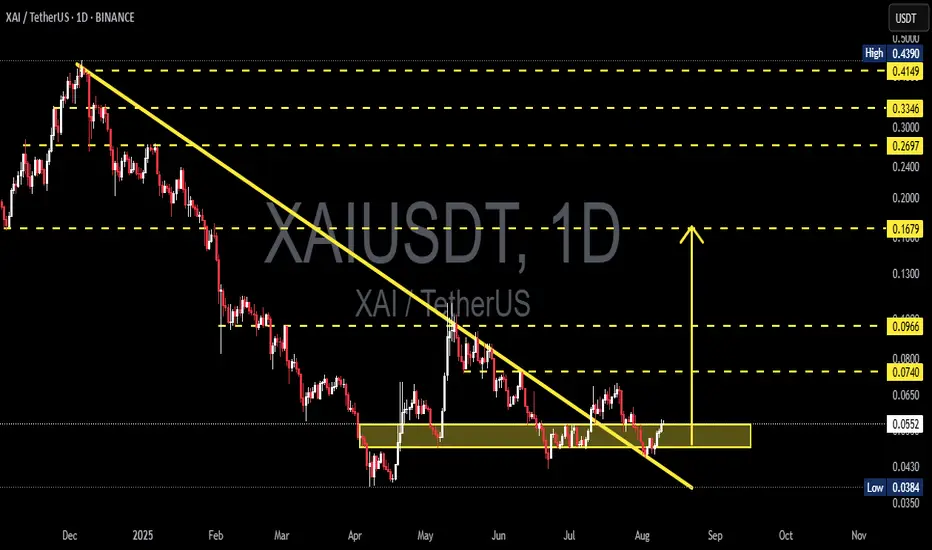
The daily chart shows XAI in a consolidation/accumulation phase within a key support zone (yellow box) after a prolonged downtrend. The long-term descending trendline (yellow) has recently been broken, signaling early signs that the downtrend may be losing momentum. However, confirmation is still needed (daily close and volume validation).
Key Levels (from the chart)
Major resistances: 0.0740, then 0.0966, 0.1679, 0.2697, (historical high ~0.4149–0.4390).
Current price: ~0.0551
Strong support/accumulation zone: around 0.043 – 0.056 (yellow box)
Breakdown low: ~0.0384
Potential moves from ~0.0551:
To 0.0740 ≈ +34.3%
To 0.0966 ≈ +75.3%
To 0.1679 ≈ +204.7%
Downside to 0.0384 ≈ -30.3%
Pattern Analysis (detailed & relevant)
Medium-term downtrend: price has been trending lower since the late 2024 peak, following a descending trendline. Recently, there was a breakout above this trendline, an early sign of trend weakening.
Accumulation zone (yellow box): price has tested and bounced from this area multiple times (April — Aug), indicating strong demand.
Possible double bottom/base formation: lows in early April and July/August at similar levels hint at a potential base-building phase. Needs confirmation with a breakout.
Key watch: A daily close above 0.0740 with strong volume would confirm bullish momentum. A breakdown below 0.0384 would confirm bearish continuation.
Bullish Scenario
1. Breakout confirmation — daily close above 0.0740 with strong volume → first target 0.0966, followed by 0.1679 and 0.2697.
2. Support retest & continuation — price may retest the accumulation box before bouncing, confirming the zone as a base for further gains.
3. Bullish signs: strong-bodied candles, successful retests, and increasing volume on breakout days.
Bearish Scenario
1. False breakout — price breaks the trendline but fails to surpass 0.0740, falling back into the range.
2. Accumulation breakdown — daily close below the yellow box (especially under 0.0384) → opens downside continuation risk.
3. Lower highs persist — continued inability to make higher highs keeps sellers in control.
Risk Management Checklist (Not financial advice)
Wait for daily close confirmation, not just intraday spikes.
Watch volume for breakout validation.
Conservative stop-loss: below the support box or 0.0384.
Take partial profits at key resistances (0.0740–0.0966), let the rest run if momentum continues.
Adjust position size according to risk per trade (e.g., 1–2% of capital).
#XAI #XAIUSDT #Crypto #TechnicalAnalysis #Breakout #SupportResistance #Accumulation #CryptoTrading
✅ Get Free Signals! Join Our Telegram Channel Here: t.me/TheCryptoNuclear
✅ Twitter: twitter.com/crypto_nuclear
✅ Join Bybit : partner.bybit.com/b/nuclearvip
✅ Benefits : Lifetime Trading Fee Discount -50%
✅ Twitter: twitter.com/crypto_nuclear
✅ Join Bybit : partner.bybit.com/b/nuclearvip
✅ Benefits : Lifetime Trading Fee Discount -50%
Aviso legal
The information and publications are not meant to be, and do not constitute, financial, investment, trading, or other types of advice or recommendations supplied or endorsed by TradingView. Read more in the Terms of Use.