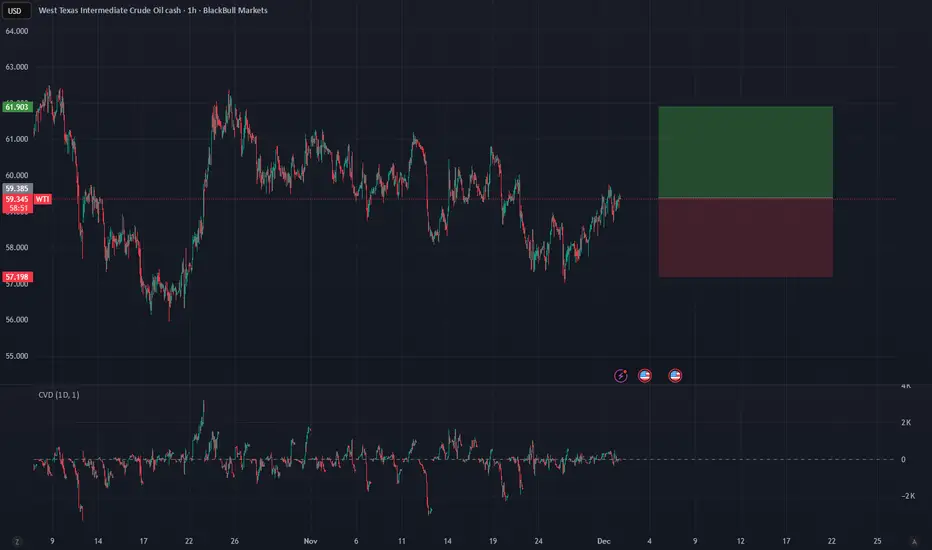
After a significant downtrend from the $66.00 highs down to the $56.00 region, WTI Crude Oil is showing signs of a structural shift on the 1H timeframe. Here is the technical breakdown suggesting a bullish recovery.
1. Market Structure & Price Action The market has stopped making lower lows. Instead, we have established a Higher Low (HL) at roughly $57.50, compared to the capitulation low at ~$56.00. This is the first sign of a potential trend change. The price is currently reacting aggressively from this support zone, pushing back towards the $59.40 level.
The immediate obstacle is the psychological $60.00 level and the local supply zone around $59.50. A breakout above this area would confirm the reversal.
2. Order Flow & CVD A crucial observation on the lower timeframe data is the divergence between Price and CVD.
The CVD remains negative (Red values on the bottom left), indicating that aggressive market selling is still present.
Interpretation: Despite this selling pressure, price is not making new lows. Instead, it is holding structure and rising.
Conclusion: This indicates Absorption. Large passive buyers (Limit Bids) are absorbing the sell-side liquidity. The sellers are expending effort but getting no result (price drop). Once the sellers are exhausted, the path of least resistance is up.
3. Trade Setup (Long Position)
Based on the absorption at support and the formation of a Higher Low, I am looking for a rotation back to the upper range.
Direction: LONG
Entry Zone: Current Market Price ($59.35) or on a retest of $59.00.
Invalidation / Stop Loss: $57.20.
Reasoning: This is placed below the recent Higher Low structure. If price breaks this level, the absorption thesis has failed, and the downtrend will likely continue to $55.
Target: $61.90.
Reasoning: Major swing high / supply zone.
Aviso legal
As informações e publicações não se destinam a ser, e não constituem, conselhos ou recomendações financeiras, de investimento, comerciais ou de outro tipo fornecidos ou endossados pela TradingView. Leia mais nos Termos de Uso.
Aviso legal
As informações e publicações não se destinam a ser, e não constituem, conselhos ou recomendações financeiras, de investimento, comerciais ou de outro tipo fornecidos ou endossados pela TradingView. Leia mais nos Termos de Uso.