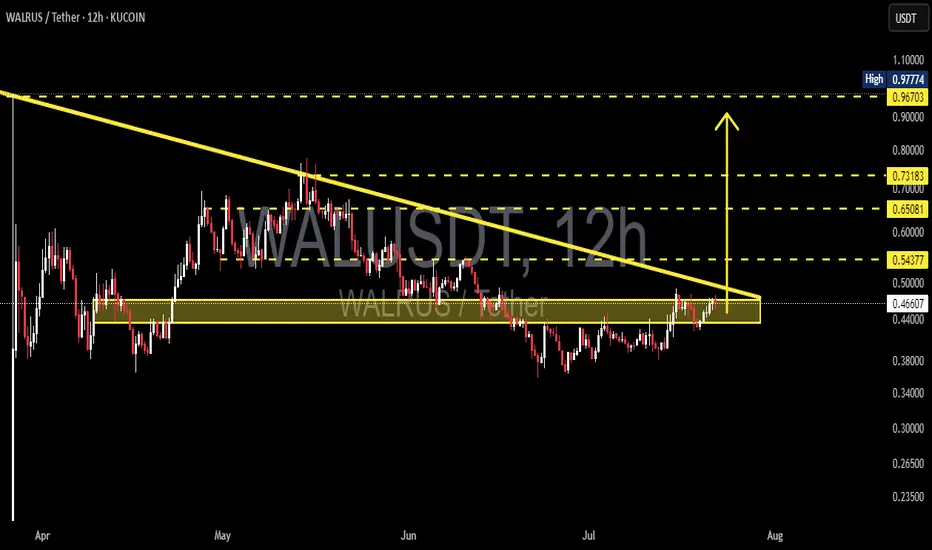
After weeks of compressed price action and relentless seller pressure, WAL is showing signs of a potential explosive move. Is this the breakout bulls have been waiting for?
🧩 Chart Pattern: Descending Triangle — With a Bullish Twist
Over the past 3 months, WAL has formed a descending triangle, typically known as a bearish continuation pattern.
But here’s the twist — WAL is breaking out upwards, signaling potential trend reversal instead.
The pattern shows higher lows meeting a horizontal resistance around $0.47–$0.48, a classic sign that buyers are gaining strength.
This setup suggests buyers are slowly overpowering the selling pressure, leading to a high-probability breakout scenario.
🟡 Strong Accumulation Zone: $0.42–$0.45
This range has consistently acted as a strong support base since mid-April.
Every dip into this zone has been met with strong buyback and increasing volume.
It likely represents a smart money accumulation zone before a larger markup phase.
🚀 Breakout Target: Where Could Price Go?
Measured move from the triangle's height projects a move of ~$0.25. From the breakout level at ~$0.48, this gives a technical target around $0.73.
🎯 Bullish Price Targets:
1. TP1: $0.543 — First breakout validation zone
2. TP2: $0.650 — Previous May resistance level
3. TP3: $0.731 — Measured move target from triangle
4. Extended Target: $0.967 – $0.977 — Prior liquidity and local high zone
With sustained volume, $1.00+ isn’t off the table.
---
🔻 Bearish Scenario:
If this breakout turns into a fakeout:
Price may revisit the support zone at $0.45–$0.42.
Breakdown below this zone opens risk toward:
🧨 $0.36 — Mid-range demand zone
Further breakdown could lead to $0.30–$0.28
Confirmation of a fakeout: A strong 12H close below the yellow box support with increasing sell volume.
🔍 Additional Bullish Confirmation Signals:
Volume should spike significantly above average to validate breakout.
RSI, MACD, or EMA crossover can help strengthen the bullish thesis if aligned.
✅ Summary
WAL/USDT is currently at a pivotal breakout moment. A confirmed move above the descending triangle could trigger a major trend reversal, with targets between $0.65 and $0.73 in sight. This setup could be one of the cleanest breakout opportunities on the charts right now.
#WALUSDT #CryptoBreakout #TechnicalAnalysis #BullishSetup #DescendingTriangle #AltcoinWatch
✅ Get Free Signals! Join Our Telegram Channel Here: t.me/TheCryptoNuclear
✅ Twitter: twitter.com/crypto_nuclear
✅ Join Bybit : partner.bybit.com/b/nuclearvip
✅ Benefits : Lifetime Trading Fee Discount -50%
✅ Twitter: twitter.com/crypto_nuclear
✅ Join Bybit : partner.bybit.com/b/nuclearvip
✅ Benefits : Lifetime Trading Fee Discount -50%
Aviso legal
As informações e publicações não se destinam a ser, e não constituem, conselhos ou recomendações financeiras, de investimento, comerciais ou de outro tipo fornecidos ou endossados pela TradingView. Leia mais nos Termos de Uso.
