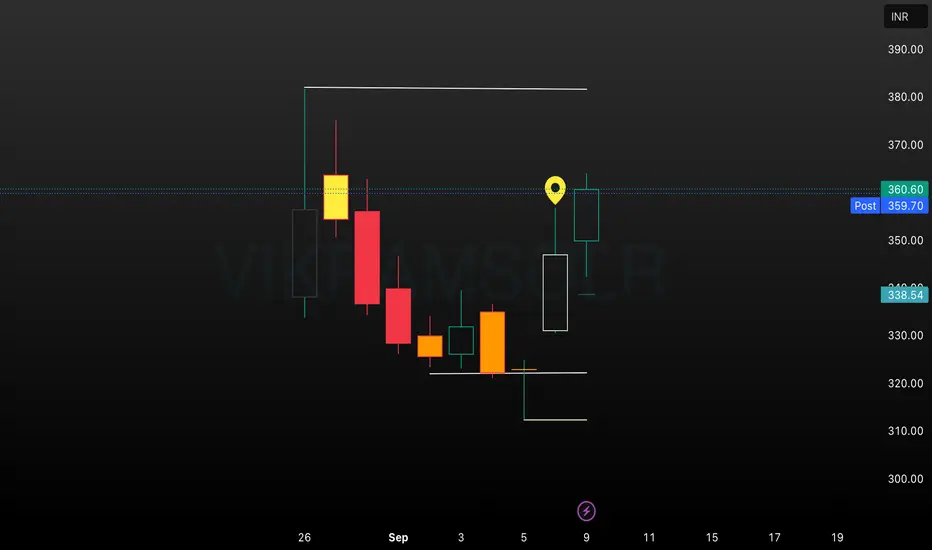
The VIKRAMSOLR daily chart illustrates a sustained recovery and momentum build-up after a series of bearish sessions. Price action rebounded from the recent low near ₹310–₹320, breaking past intermediate resistances with expanding volume and energized candlestick formation. The highlighted region signals renewed bullish participation and possible extension towards the next resistance
Aviso legal
As informações e publicações não se destinam a ser, e não constituem, conselhos ou recomendações financeiras, de investimento, comerciais ou de outro tipo fornecidos ou endossados pela TradingView. Leia mais nos Termos de Uso.
Aviso legal
As informações e publicações não se destinam a ser, e não constituem, conselhos ou recomendações financeiras, de investimento, comerciais ou de outro tipo fornecidos ou endossados pela TradingView. Leia mais nos Termos de Uso.
