Viés de alta
Technical analysis of the weekly chart of Varroc Engineering Ltd
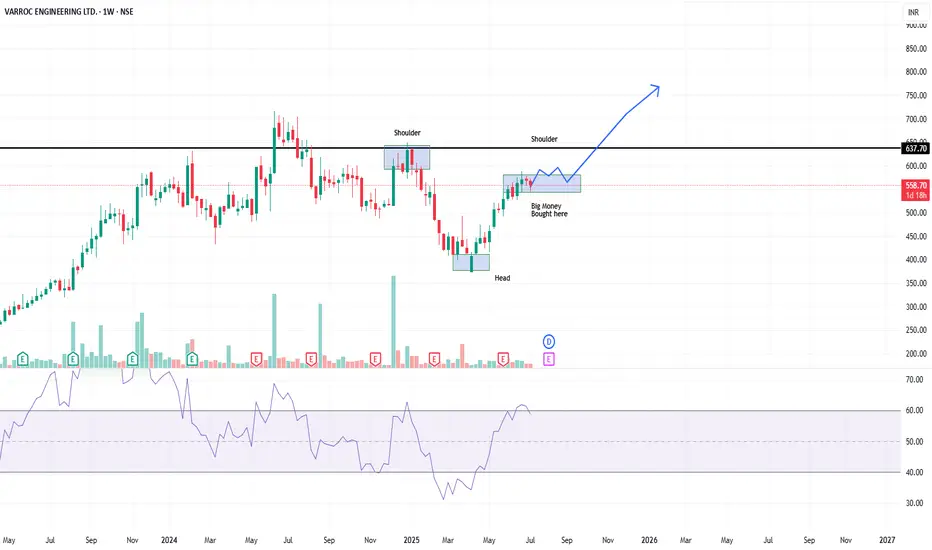
Pattern Details:
✅Left Shoulder: Formed around ₹635 in early 2024
✅Head: Major low near ₹370 in early 2025
✅Right Shoulder: Formed around ₹560–580 in mid-2025
✅Neckline: Strong horizontal resistance at ₹637.70 (clearly drawn)
✅Volume: Noticeable accumulation at the head and near right shoulder = "Big Money Bought Here"
Sentiment & Setup Summary
✅ Bullish Setup — Inverse Head & Shoulders
✅ Volume supports the move — Accumulation is visible
✅ Big Money Participation — Potential institutional accumulation
⏳ Breakout Pending — Needs confirmation above ₹638
If breakout is clean:
Could result in strong multi-week uptrend
Target ~₹800 over medium-term (3–6 months)
Aviso legal
As informações e publicações não devem ser e não constituem conselhos ou recomendações financeiras, de investimento, de negociação ou de qualquer outro tipo, fornecidas ou endossadas pela TradingView. Leia mais em Termos de uso.
Aviso legal
As informações e publicações não devem ser e não constituem conselhos ou recomendações financeiras, de investimento, de negociação ou de qualquer outro tipo, fornecidas ou endossadas pela TradingView. Leia mais em Termos de uso.