# Visa Inc. (V) – Daily Chart Deep Dive
## 1. Price Structure & Trend Pattern
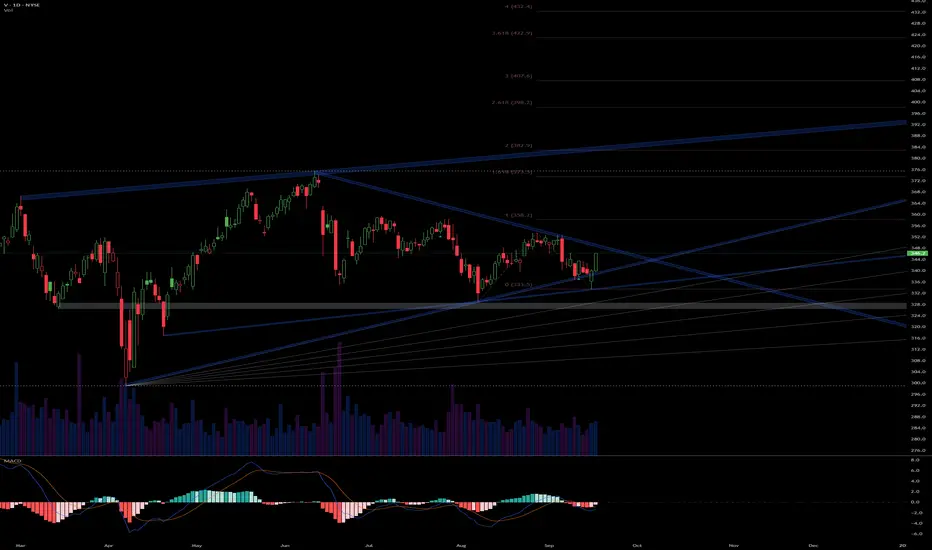
- The daily candles from April through mid-September trace a classic descending triangle: a series of lower highs feeding off the upper trendline, while horizontal support around 351.13 holds repeatedly.
- A descending triangle often signals distribution—supply overwhelming demand—but it can also form late in a broader uptrend as a bullish continuation pattern. Context is key: Visa’s multi-year uptrend remains intact above 280, so this consolidation could be a re-accumulation phase.
## 2. Volume Analysis
- Volume has steadily contracted as the triangle has narrowed, indicating lower conviction from both buyers and sellers—a hallmark of both continued consolidation or a Coiling Wyckoff re-accumulation.
- Look for a volume spike above the 20-day average on any breakout (up or down) to validate the move. A high-volume break below 351.13 would mark a Sign of Weakness (SOW), while a high-volume break above 359.73–370.61 would represent a Sign of Strength (SOS).
## 3. Momentum (MACD)
- The MACD lines are converging just below zero, and the histogram shows a slight bullish divergence: price making a marginally lower low near support while momentum holds flat or ticks higher.
- A bullish MACD cross here would reinforce a breakout scenario, especially if momentum turns positive and climbs above the zero-line.
## 4. Key Price Levels
| Price Level | Role |
|------------:|-----------------------------------|
| 370.61 | Upper trendline resistance |
| 359.73 | Near-term pivot resistance zone |
| 351.13 | Horizontal support (triangle base)|
| 337.12 | Secondary support zone |
## 5. Wyckoff Phase Mapping
- This structure most resembles a **Re-Accumulation**:
• **Preliminary Support (PS):** Multiple tests of 351.13 with waning volume.
• **Selling Climax (SC) & Automatic Rally (AR):** The swing from 337.12 up to ~370 formed the AR, then secondary tests near SC.
• **Secondary Test (ST):** Recent touches of support with lower volume.
• **Coiling:** The narrowing price range and lower volume prepare for a final breakout (Upthrust or Spring).
## 1. Price Structure & Trend Pattern
- The daily candles from April through mid-September trace a classic descending triangle: a series of lower highs feeding off the upper trendline, while horizontal support around 351.13 holds repeatedly.
- A descending triangle often signals distribution—supply overwhelming demand—but it can also form late in a broader uptrend as a bullish continuation pattern. Context is key: Visa’s multi-year uptrend remains intact above 280, so this consolidation could be a re-accumulation phase.
## 2. Volume Analysis
- Volume has steadily contracted as the triangle has narrowed, indicating lower conviction from both buyers and sellers—a hallmark of both continued consolidation or a Coiling Wyckoff re-accumulation.
- Look for a volume spike above the 20-day average on any breakout (up or down) to validate the move. A high-volume break below 351.13 would mark a Sign of Weakness (SOW), while a high-volume break above 359.73–370.61 would represent a Sign of Strength (SOS).
## 3. Momentum (MACD)
- The MACD lines are converging just below zero, and the histogram shows a slight bullish divergence: price making a marginally lower low near support while momentum holds flat or ticks higher.
- A bullish MACD cross here would reinforce a breakout scenario, especially if momentum turns positive and climbs above the zero-line.
## 4. Key Price Levels
| Price Level | Role |
|------------:|-----------------------------------|
| 370.61 | Upper trendline resistance |
| 359.73 | Near-term pivot resistance zone |
| 351.13 | Horizontal support (triangle base)|
| 337.12 | Secondary support zone |
## 5. Wyckoff Phase Mapping
- This structure most resembles a **Re-Accumulation**:
• **Preliminary Support (PS):** Multiple tests of 351.13 with waning volume.
• **Selling Climax (SC) & Automatic Rally (AR):** The swing from 337.12 up to ~370 formed the AR, then secondary tests near SC.
• **Secondary Test (ST):** Recent touches of support with lower volume.
• **Coiling:** The narrowing price range and lower volume prepare for a final breakout (Upthrust or Spring).
Publicações relacionadas
Aviso legal
As informações e publicações não devem ser e não constituem conselhos ou recomendações financeiras, de investimento, de negociação ou de qualquer outro tipo, fornecidas ou endossadas pela TradingView. Leia mais em Termos de uso.
Publicações relacionadas
Aviso legal
As informações e publicações não devem ser e não constituem conselhos ou recomendações financeiras, de investimento, de negociação ou de qualquer outro tipo, fornecidas ou endossadas pela TradingView. Leia mais em Termos de uso.