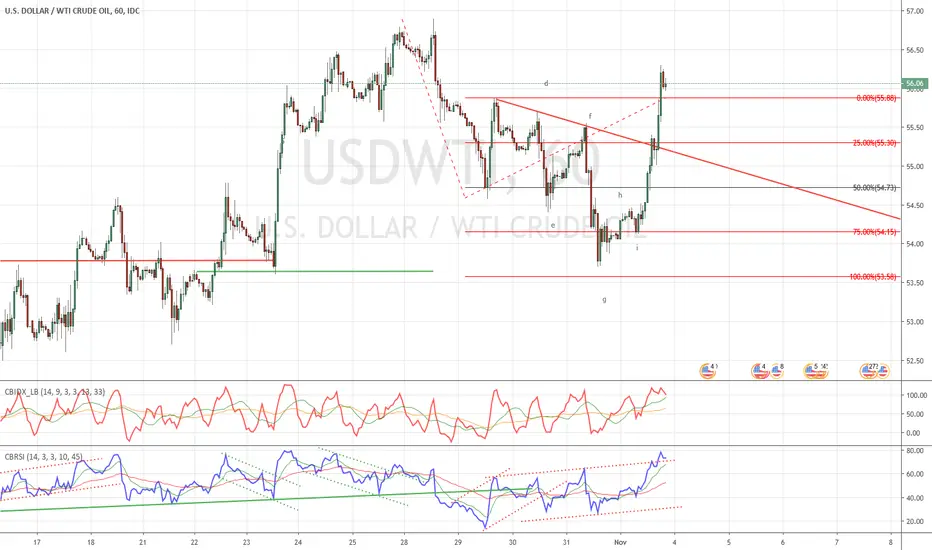
Yesterday the price action of WTI made a promising bullish setup.
First of all the bearish trend on the hourly chart, which started on October 28th, ended a few cents above the projected price range of $53,58.
Since then a strong opposite bullish price reaction has unfolded which broke many resistances.
Furthermore, the RSI broke out of a descending channel (negative reversal) and reached the 80 area, strengthening the bullish outlook of WTI.
Before getting long you should wait for a price pullback. This will give you the opportunity to calculate the price projections.
Aviso legal
As informações e publicações não devem ser e não constituem conselhos ou recomendações financeiras, de investimento, de negociação ou de qualquer outro tipo, fornecidas ou endossadas pela TradingView. Leia mais em Termos de uso.
Aviso legal
As informações e publicações não devem ser e não constituem conselhos ou recomendações financeiras, de investimento, de negociação ou de qualquer outro tipo, fornecidas ou endossadas pela TradingView. Leia mais em Termos de uso.