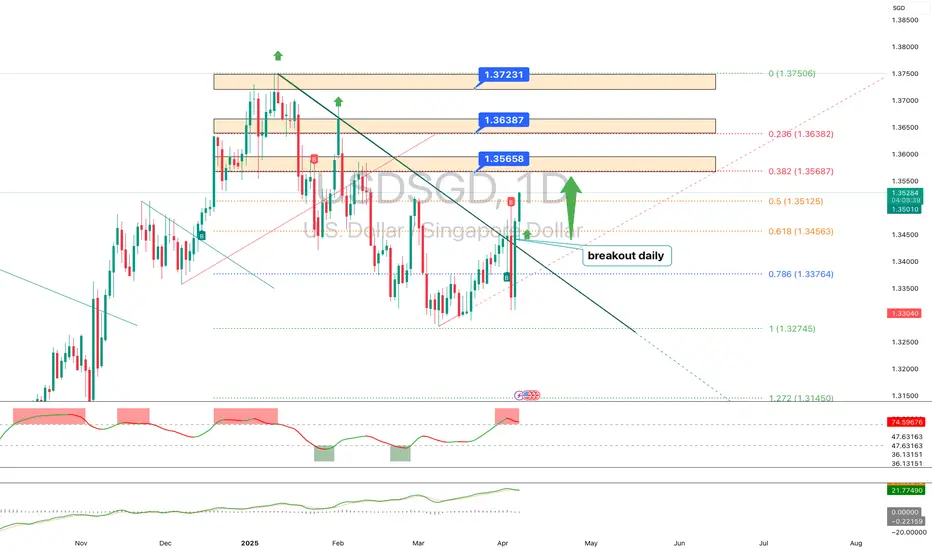
USDSGD has broken out of a descending trendline on the daily timeframe – signaling a potential shift in short-term momentum. Price has held above 1.3510, confirming the breakout and opening the door to resistance zones at 1.3565–1.3638 (aligned with 0.382 and 0.236 Fibonacci levels).
If bulls stay in control, next targets lie at 1.3723 and 1.3750. However, a short pullback toward the 1.3450–1.3480 support zone (0.618 Fibo) is also possible.
🔹 Main scenario: continuation to 1.3565 → 1.3638 → 1.3723.
🔹 Alternative scenario: drop below 1.3450 toward 1.3376 or 1.3274.
If bulls stay in control, next targets lie at 1.3723 and 1.3750. However, a short pullback toward the 1.3450–1.3480 support zone (0.618 Fibo) is also possible.
🔹 Main scenario: continuation to 1.3565 → 1.3638 → 1.3723.
🔹 Alternative scenario: drop below 1.3450 toward 1.3376 or 1.3274.
👨🎓 Наш телеграм t.me/totoshkatrading
🉐 Платформы linktr.ee/totoshka55
💬 Наши контакты @Totoshkatips
🔗 Сайт totoshkatrades.com
🉐 Платформы linktr.ee/totoshka55
💬 Наши контакты @Totoshkatips
🔗 Сайт totoshkatrades.com
Aviso legal
As informações e publicações não devem ser e não constituem conselhos ou recomendações financeiras, de investimento, de negociação ou de qualquer outro tipo, fornecidas ou endossadas pela TradingView. Leia mais em Termos de uso.