Technical Analysis of USDCAD chart
1. Market Structure Shift
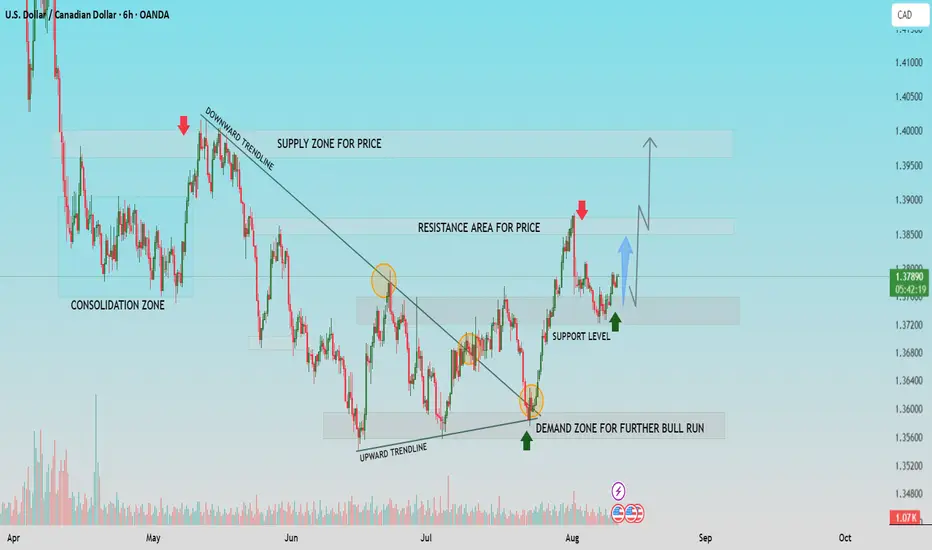
Price has transitioned from a downward trendline to an upward trendline, signaling a shift from bearish to bullish sentiment. This structural change indicates that buyers are gaining control of the market.
2. Key Demand Zone Driving the Rally
The 1.3570-1.3620 demand zone acted as a strong base for the recent bullish move. This area represents where buyers aggressively stepped in, triggering a sustained rally toward higher levels.
3. Current Support Level Holding Firm
After rejecting the resistance area, price is consolidating above the support level around 1.3750-1.3780. Holding this level is crucial for the continuation of the uptrend.
4. Resistance and Breakout Potential
The 1.3850-1.3900 resistance area is the immediate hurdle for bulls. A breakout and close above this zone would likely attract further buying pressure, targeting the 1.4000 supply zone.
5. Bullish Continuation Outlook
As long as the support level remains intact, the technical bias is bullish. Pullbacks into support may provide buying opportunities, with upside targets toward 1.3900 and potentially 1.4000. A break below support would be the first sign of possible trend weakness.
If this helpful for you, press the like button.
1. Market Structure Shift
Price has transitioned from a downward trendline to an upward trendline, signaling a shift from bearish to bullish sentiment. This structural change indicates that buyers are gaining control of the market.
2. Key Demand Zone Driving the Rally
The 1.3570-1.3620 demand zone acted as a strong base for the recent bullish move. This area represents where buyers aggressively stepped in, triggering a sustained rally toward higher levels.
3. Current Support Level Holding Firm
After rejecting the resistance area, price is consolidating above the support level around 1.3750-1.3780. Holding this level is crucial for the continuation of the uptrend.
4. Resistance and Breakout Potential
The 1.3850-1.3900 resistance area is the immediate hurdle for bulls. A breakout and close above this zone would likely attract further buying pressure, targeting the 1.4000 supply zone.
5. Bullish Continuation Outlook
As long as the support level remains intact, the technical bias is bullish. Pullbacks into support may provide buying opportunities, with upside targets toward 1.3900 and potentially 1.4000. A break below support would be the first sign of possible trend weakness.
If this helpful for you, press the like button.
Trade ativo
Nota
hold your trades, Nota
100 pips+ achieved , set BETrade fechado: objetivo atingido
💸FREE FOREX Signals in Telegram : t.me/FxInsightsHub0
🔹Join Our Telegram Channel, Pure Price Action Based Signals With Chart Analysis.
t.me/FxInsightsHub0
🚀FREE CRYPTO Signals In Telegram: t.me/FxInsightsHub0
🔹Join Our Telegram Channel, Pure Price Action Based Signals With Chart Analysis.
t.me/FxInsightsHub0
🚀FREE CRYPTO Signals In Telegram: t.me/FxInsightsHub0
Publicações relacionadas
Aviso legal
As informações e publicações não devem ser e não constituem conselhos ou recomendações financeiras, de investimento, de negociação ou de qualquer outro tipo, fornecidas ou endossadas pela TradingView. Leia mais em Termos de uso.