We have seen mixed price action for the last four days, with rallies finding sellers and dips finding buyers
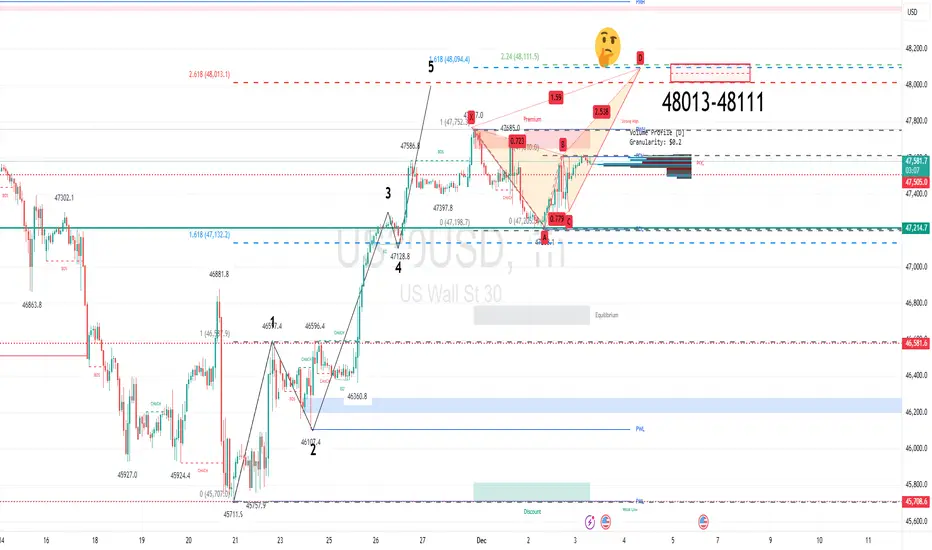
The intraday chart highlights a 261.8% extension level at 48,013. A move to this zone would be analysed as the completion of a bullish 5 Wave count (Elliott Wave).
The current mixed daily results look to be forming a Crab pattern. That will be completed on a move to 48,111.
Conclusion: the medium-term bias is bearish. The preferred stance would be to sell into rallies within the 48,013-48,111 zone.
Please ask me for a current Discord link
Aviso legal
As informações e publicações não se destinam a ser, e não constituem, conselhos ou recomendações financeiras, de investimento, comerciais ou de outro tipo fornecidos ou endossados pela TradingView. Leia mais nos Termos de Uso.
Please ask me for a current Discord link
Aviso legal
As informações e publicações não se destinam a ser, e não constituem, conselhos ou recomendações financeiras, de investimento, comerciais ou de outro tipo fornecidos ou endossados pela TradingView. Leia mais nos Termos de Uso.