Viés de baixa
US 100 (A BEARISH PATTERN)
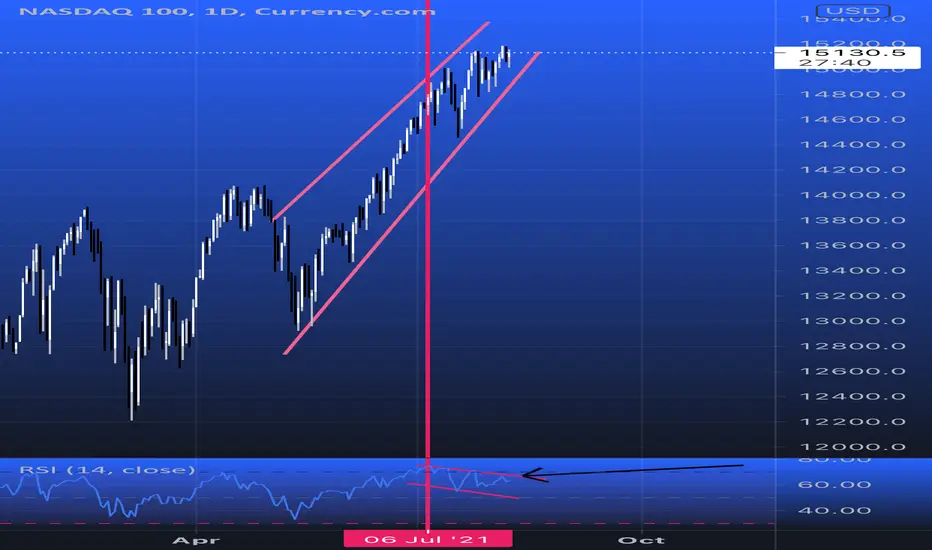
Here we can see clearly the US Index seems to have formed a double top (M), a bearish pattern, on the daily time frame. The RSI indicator is also showing us a Divergence down trend from the actual chart + it’s also near the overbought territory.
Keep an eye on the US INDEX over coming days or week. Happy pip hunting traders.
Keep an eye on the US INDEX over coming days or week. Happy pip hunting traders.
Publicações relacionadas
Aviso legal
As informações e publicações não devem ser e não constituem conselhos ou recomendações financeiras, de investimento, de negociação ou de qualquer outro tipo, fornecidas ou endossadas pela TradingView. Leia mais em Termos de uso.
Publicações relacionadas
Aviso legal
As informações e publicações não devem ser e não constituem conselhos ou recomendações financeiras, de investimento, de negociação ou de qualquer outro tipo, fornecidas ou endossadas pela TradingView. Leia mais em Termos de uso.