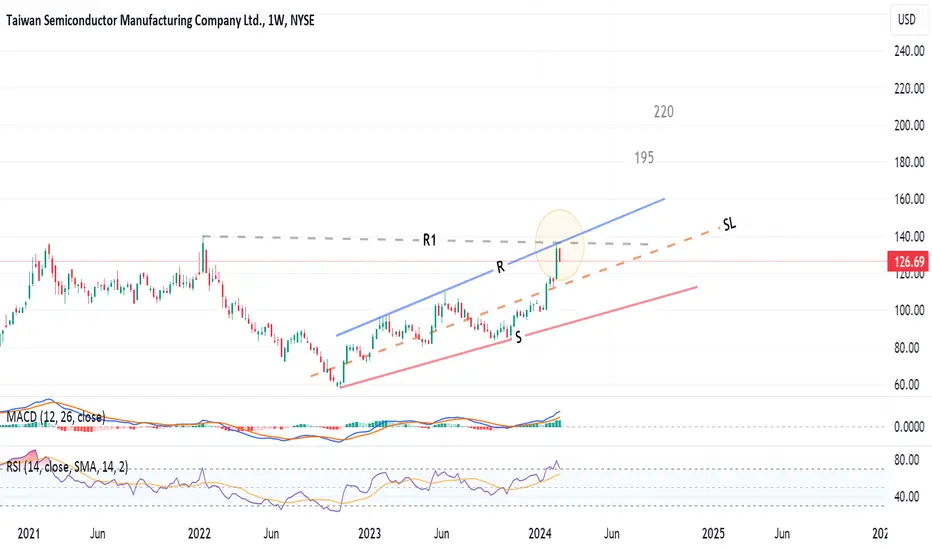
Weekly chart, the stock reached a cluster of resistances R1 and R, and could not cross.
There is a tendency to test the mid line or the support line S
Above the R line, a rising expanding wedge pattern will be completed, and the target will be 195 then 220
Stop loss below SL line
There is a tendency to test the mid line or the support line S
Above the R line, a rising expanding wedge pattern will be completed, and the target will be 195 then 220
Stop loss below SL line
Aviso legal
As informações e publicações não se destinam a ser, e não constituem, conselhos ou recomendações financeiras, de investimento, comerciais ou de outro tipo fornecidos ou endossados pela TradingView. Leia mais nos Termos de Uso.
Aviso legal
As informações e publicações não se destinam a ser, e não constituem, conselhos ou recomendações financeiras, de investimento, comerciais ou de outro tipo fornecidos ou endossados pela TradingView. Leia mais nos Termos de Uso.