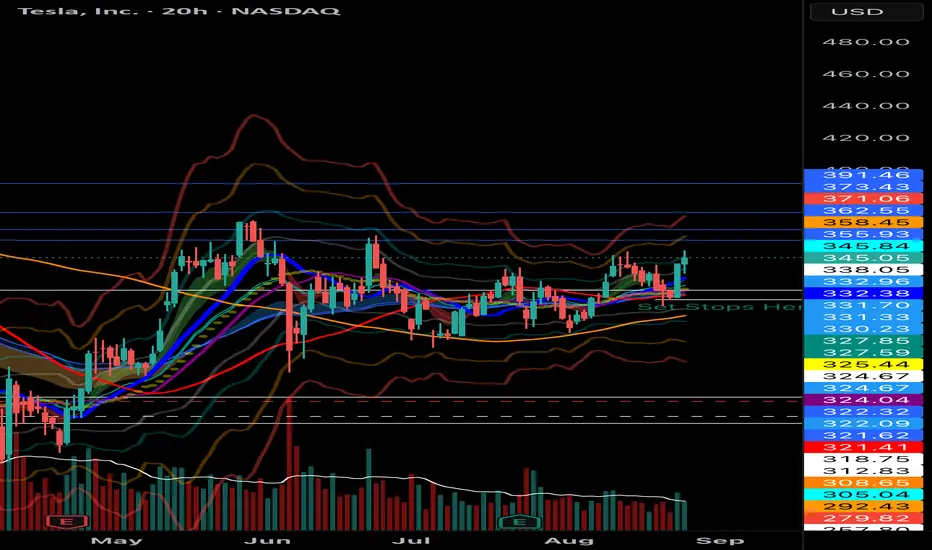
When TSLA breaks above 350 and closes, the price will launch to $390 very quickly.
A VCP is a technical pattern, showing lessening declines in a range bound formation. A bull flag showing higher-lows is the best, as seen with TSLA.
Volatility is going to breakout sharply to the upside. If you TSLA above 350 just buy and hold, you’re too late trying to get a better deal.
🚀🚀🚀🌖
A VCP is a technical pattern, showing lessening declines in a range bound formation. A bull flag showing higher-lows is the best, as seen with TSLA.
Volatility is going to breakout sharply to the upside. If you TSLA above 350 just buy and hold, you’re too late trying to get a better deal.
🚀🚀🚀🌖
Trade ativo
Took some profit, will buy in with capital on a retracement lower. Trade fechado: objetivo atingido
Trade ClosedAviso legal
As informações e publicações não devem ser e não constituem conselhos ou recomendações financeiras, de investimento, de negociação ou de qualquer outro tipo, fornecidas ou endossadas pela TradingView. Leia mais em Termos de uso.
Aviso legal
As informações e publicações não devem ser e não constituem conselhos ou recomendações financeiras, de investimento, de negociação ou de qualquer outro tipo, fornecidas ou endossadas pela TradingView. Leia mais em Termos de uso.