Breakdown (what the chart shows):
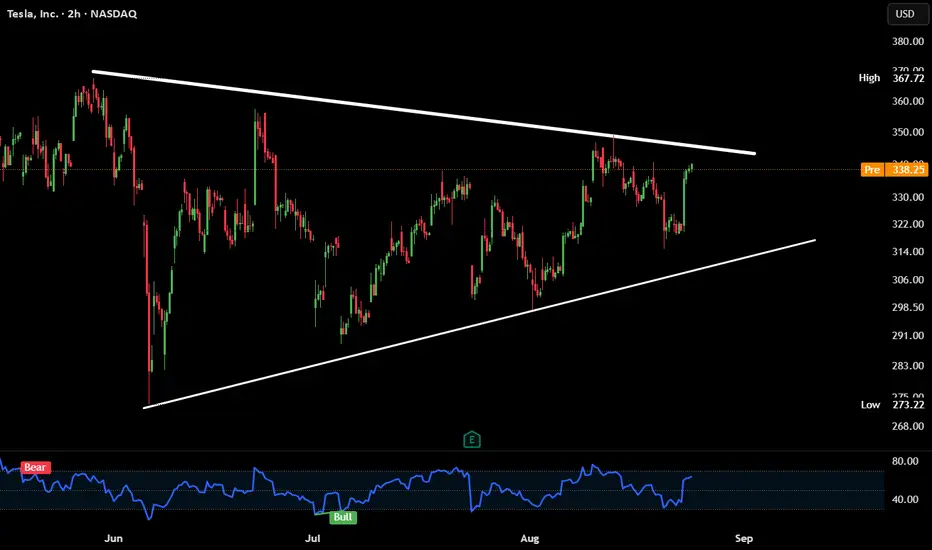
Tesla is forming a symmetrical triangle on the 2H chart. Price is squeezing between higher lows and lower highs.
Currently testing resistance near $338–340. Breakout or rejection incoming.
Confluence:
1. RSI bouncing back from near oversold → bullish momentum returning.
CTA :
Which way do you think it breaks — up or down?
Would you trade the breakout or fade the first move?
Aviso legal
As informações e publicações não se destinam a ser, e não constituem, conselhos ou recomendações financeiras, de investimento, comerciais ou de outro tipo fornecidos ou endossados pela TradingView. Leia mais nos Termos de Uso.
Aviso legal
As informações e publicações não se destinam a ser, e não constituem, conselhos ou recomendações financeiras, de investimento, comerciais ou de outro tipo fornecidos ou endossados pela TradingView. Leia mais nos Termos de Uso.