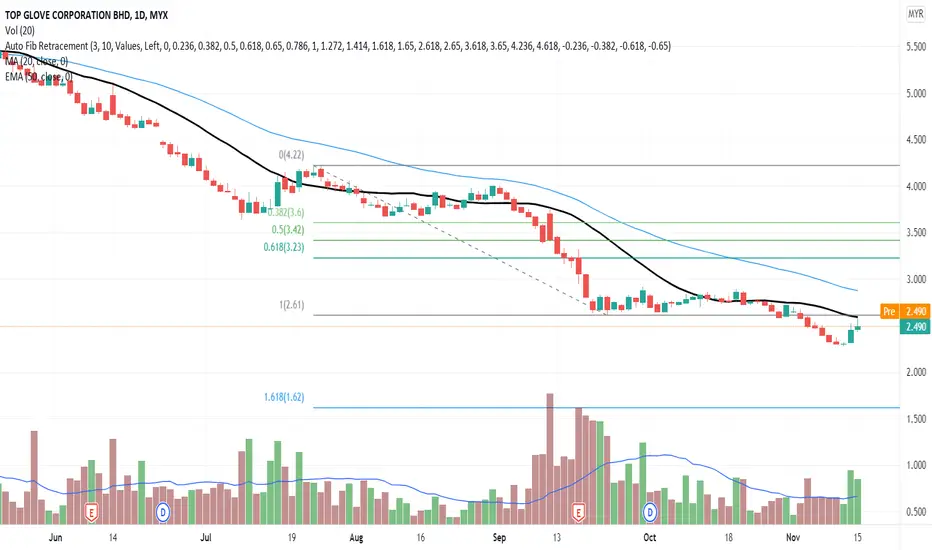
Using Fibonacci Retracement chart, TOPGLOVE price in reversal pattern and trying to hit above MA20 line with volume above MA20. If the candlestick body closed above MA20, then it will be a uptrend pattern.
MACD and OBV charts indicate a divergence signal. Possibility of strong uptrend position.
Put TOPGLOVE in your WL and watch out for significant price movement with volume.
R 2.73
S 2.30
MACD and OBV charts indicate a divergence signal. Possibility of strong uptrend position.
Put TOPGLOVE in your WL and watch out for significant price movement with volume.
R 2.73
S 2.30
Aviso legal
As informações e publicações não se destinam a ser, e não constituem, conselhos ou recomendações financeiras, de investimento, comerciais ou de outro tipo fornecidos ou endossados pela TradingView. Leia mais nos Termos de Uso.
Aviso legal
As informações e publicações não se destinam a ser, e não constituem, conselhos ou recomendações financeiras, de investimento, comerciais ou de outro tipo fornecidos ou endossados pela TradingView. Leia mais nos Termos de Uso.