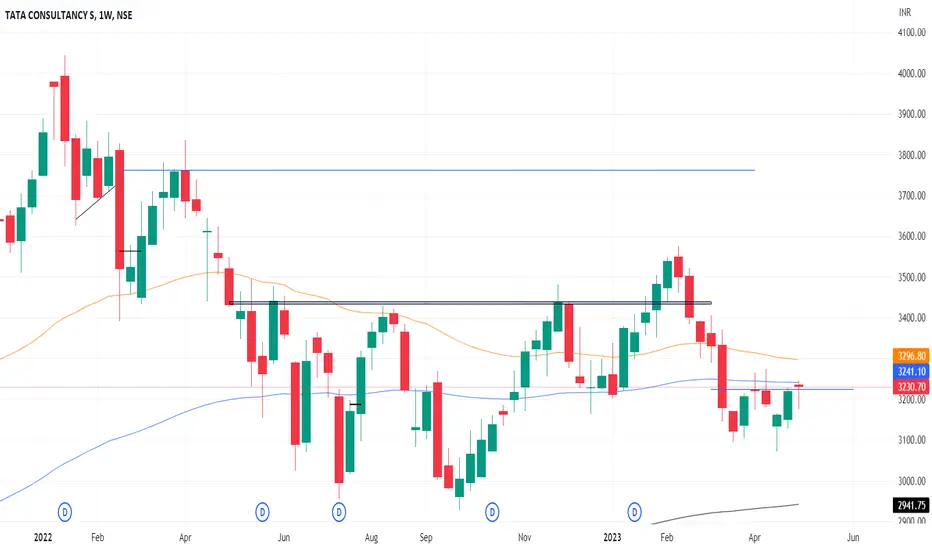
In the Weekly Chart of TCS ,
we can see that, it has a recovery in W pattern.
Bullish Candle is foamed on support.
Enter on breaking its high with Low as SL and Go very Long.
we can see that, it has a recovery in W pattern.
Bullish Candle is foamed on support.
Enter on breaking its high with Low as SL and Go very Long.
Aviso legal
As informações e publicações não se destinam a ser, e não constituem, conselhos ou recomendações financeiras, de investimento, comerciais ou de outro tipo fornecidos ou endossados pela TradingView. Leia mais nos Termos de Uso.
Aviso legal
As informações e publicações não se destinam a ser, e não constituem, conselhos ou recomendações financeiras, de investimento, comerciais ou de outro tipo fornecidos ou endossados pela TradingView. Leia mais nos Termos de Uso.