Viés de alta
TCS Eyes Recovery After Holding Strong at Key Support Levels
Topic Statement:
TCS has shown signs of recovery after a recent correction, with strong technical support levels reinforcing bullish potential.
Key Points:
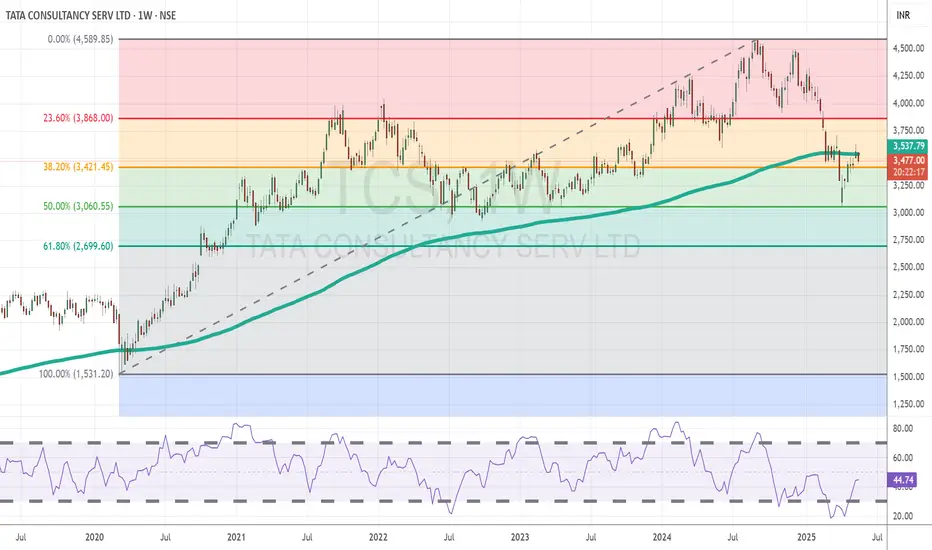
The price previously found strong and consistent support near the ₹3000 mark, reaffirmed during the recent market correction.
A full retracement to the 50% Fibonacci level** at ₹3060 attracted significant buying interest, highlighting renewed strength.
Currently, the stock trades just below the 200-day EMA, indicating it remains in oversold territory, but with potential for reversal if momentum continues.
TCS has shown signs of recovery after a recent correction, with strong technical support levels reinforcing bullish potential.
Key Points:
The price previously found strong and consistent support near the ₹3000 mark, reaffirmed during the recent market correction.
A full retracement to the 50% Fibonacci level** at ₹3060 attracted significant buying interest, highlighting renewed strength.
Currently, the stock trades just below the 200-day EMA, indicating it remains in oversold territory, but with potential for reversal if momentum continues.
Aviso legal
As informações e publicações não devem ser e não constituem conselhos ou recomendações financeiras, de investimento, de negociação ou de qualquer outro tipo, fornecidas ou endossadas pela TradingView. Leia mais em Termos de uso.
Aviso legal
As informações e publicações não devem ser e não constituem conselhos ou recomendações financeiras, de investimento, de negociação ou de qualquer outro tipo, fornecidas ou endossadas pela TradingView. Leia mais em Termos de uso.