Key Technical Levels for the 1-Week Timeframe:
Immediate Support: ₹383.25 to ₹383.80
Next Support Level: ₹370.00
Immediate Resistance: ₹386.39
Next Resistance Level: ₹391.47
If the stock breaks below ₹383.25, it may test ₹370.00. Conversely, a rise above ₹391.47 could indicate a potential reversal.
Technical Indicators:
Relative Strength Index (RSI): Approximately 30.5, nearing oversold territory.
Moving Average Convergence Divergence (MACD): Currently at -2.66, indicating bearish momentum.
Moving Averages: The 5-day moving average is ₹384.54, suggesting short-term bearishness.
Fundamental insights:
Intrinsic Value: Estimated at ₹211.62, suggesting the stock is currently overvalued.
Profitability: The company reported a 6% year-on-year increase in Q1 net profit to ₹1,262 crore, driven by stronger revenues from renewable energy and transmission & distribution segments.
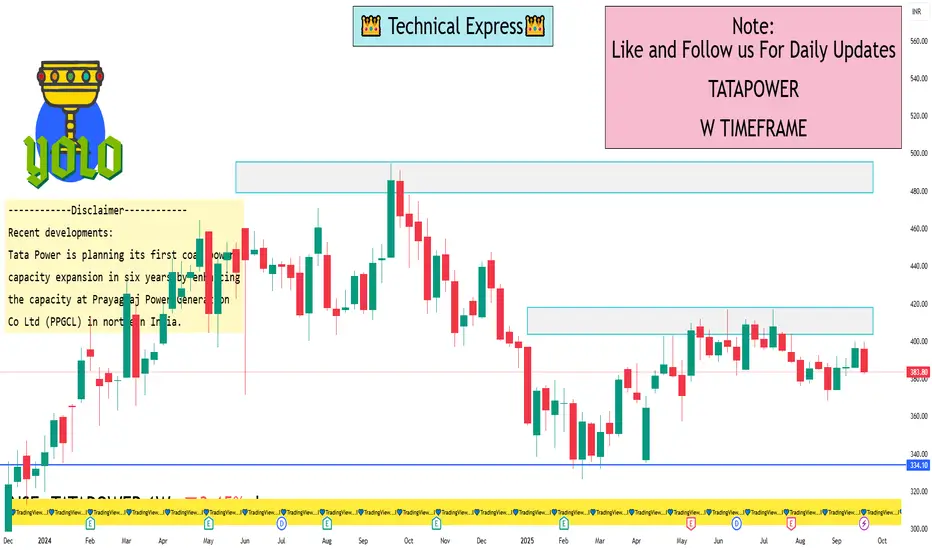
Recent developments:
Tata Power is planning its first coal power capacity expansion in six years by enhancing the capacity at Prayagraj Power Generation Co Ltd (PPGCL) in northern India.
Outlook:
The stock is currently in a downtrend, with technical indicators favoring a bearish scenario. Investors should monitor support levels closely and consider waiting for a confirmed reversal before making any investment decisions.
Immediate Support: ₹383.25 to ₹383.80
Next Support Level: ₹370.00
Immediate Resistance: ₹386.39
Next Resistance Level: ₹391.47
If the stock breaks below ₹383.25, it may test ₹370.00. Conversely, a rise above ₹391.47 could indicate a potential reversal.
Technical Indicators:
Relative Strength Index (RSI): Approximately 30.5, nearing oversold territory.
Moving Average Convergence Divergence (MACD): Currently at -2.66, indicating bearish momentum.
Moving Averages: The 5-day moving average is ₹384.54, suggesting short-term bearishness.
Fundamental insights:
Intrinsic Value: Estimated at ₹211.62, suggesting the stock is currently overvalued.
Profitability: The company reported a 6% year-on-year increase in Q1 net profit to ₹1,262 crore, driven by stronger revenues from renewable energy and transmission & distribution segments.
Recent developments:
Tata Power is planning its first coal power capacity expansion in six years by enhancing the capacity at Prayagraj Power Generation Co Ltd (PPGCL) in northern India.
Outlook:
The stock is currently in a downtrend, with technical indicators favoring a bearish scenario. Investors should monitor support levels closely and consider waiting for a confirmed reversal before making any investment decisions.
I built a Buy & Sell Signal Indicator with 85% accuracy.
📈 Get access via DM or
WhatsApp: wa.link/d997q0
Contact - +91 76782 40962
| Email: techncialexpress@gmail.com
| Script Coder | Trader | Investor | From India
📈 Get access via DM or
WhatsApp: wa.link/d997q0
Contact - +91 76782 40962
| Email: techncialexpress@gmail.com
| Script Coder | Trader | Investor | From India
Publicações relacionadas
Aviso legal
As informações e publicações não se destinam a ser, e não constituem, conselhos ou recomendações financeiras, de investimento, comerciais ou de outro tipo fornecidos ou endossados pela TradingView. Leia mais nos Termos de Uso.