📉 1-Week Price Movement
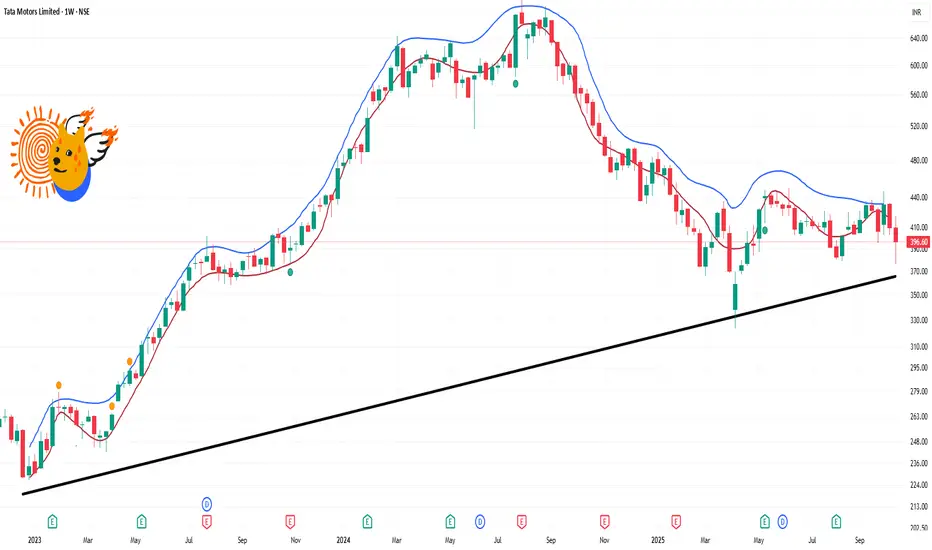
Current Price: ₹396.60
52-Week Range: ₹321.45 – ₹550.62
Recent Performance: The stock has experienced a significant decline of approximately 41.77% over the past week, largely due to the demerger of its commercial vehicle business.
📊 Technical Indicators (Weekly Overview)
Moving Averages: The stock is trading below key moving averages, indicating a bearish trend.
Relative Strength Index (RSI): The RSI is below 30, suggesting the stock is in oversold territory.
MACD: The MACD line is below the signal line, confirming a bearish momentum.
Stochastic Oscillator: The stochastic indicator is in the oversold zone, which may imply a potential reversal if buying interest returns.
Publicações relacionadas
Aviso legal
As informações e publicações não se destinam a ser, e não constituem, conselhos ou recomendações financeiras, de investimento, comerciais ou de outro tipo fornecidos ou endossados pela TradingView. Leia mais nos Termos de Uso.
Publicações relacionadas
Aviso legal
As informações e publicações não se destinam a ser, e não constituem, conselhos ou recomendações financeiras, de investimento, comerciais ou de outro tipo fornecidos ou endossados pela TradingView. Leia mais nos Termos de Uso.