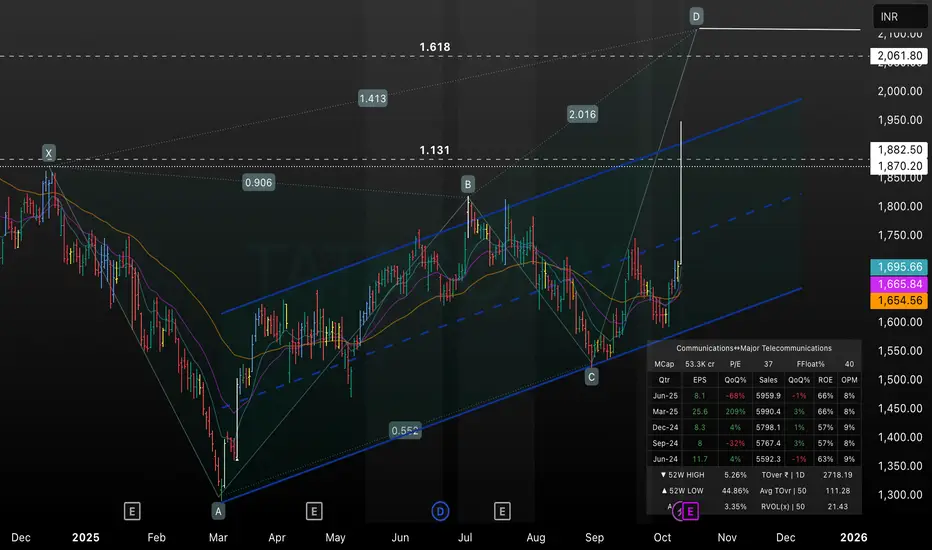
This TradingView chart analyzes TATA Communications (TATACOM) bullish price action as of October 2025, showcasing a breakout from a multi-month ascending channel. Key Fibonacci extension targets (1.131, 1.413, 1.618) are plotted for projected moves toward ₹2,061.80, with support and resistance levels derived from price swings and channel boundaries. The chart highlights rapid momentum following a pivot from point C, using multi-timeframe EMA overlays and ATR bands for confirmation. Major metrics, including market cap, P/E, EPS, and institutional holdings, are summarized for fundamental context. This technical setup is ideal for traders seeking actionable breakout and retracement levels in TATACOM using advanced charting and precision risk management strateg
Aviso legal
As informações e publicações não devem ser e não constituem conselhos ou recomendações financeiras, de investimento, de negociação ou de qualquer outro tipo, fornecidas ou endossadas pela TradingView. Leia mais em Termos de uso.
Aviso legal
As informações e publicações não devem ser e não constituem conselhos ou recomendações financeiras, de investimento, de negociação ou de qualquer outro tipo, fornecidas ou endossadas pela TradingView. Leia mais em Termos de uso.