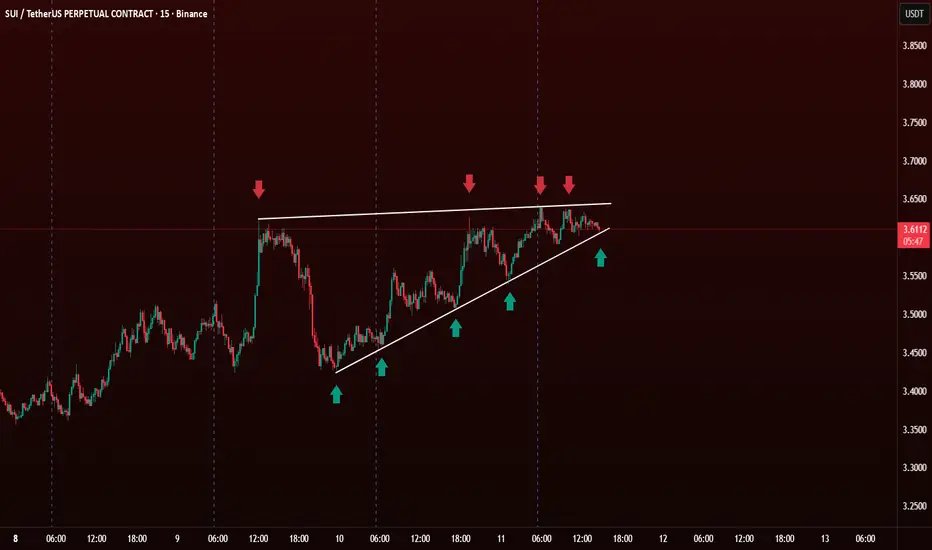
The Ascending Triangle is a bullish continuation pattern. It forms when the price creates higher lows (🔼) while facing consistent resistance at the same horizontal level (🔴).
🧐 How to Identify It
📊 How to Trade It

 SUIUSDT.P
🧐 How to Identify It
- Flat Resistance Line 🔴
- Price hits the same level multiple times and gets rejected.
- This creates a horizontal line on top.
- Rising Support Trendline 🔼
Each dip forms a higher low, indicating buying pressure.
Connect the swing lows with a rising trendline 📈.
📊 How to Trade It
Entry : Breakout Entry: Enter when price breaks and closes above the resistance line with high volume 💥.Conservative traders wait for a retest of the breakout zone (resistance becomes support).
Target : Measure the height of the triangle and project it upward from the breakout point.
Example: If triangle height = $0.30, add $0.30 above breakout.
Stop Loss : Below the last higher low 🔽 Or slightly below the triangle support trendline 📉
Aviso legal
As informações e publicações não se destinam a ser, e não constituem, conselhos ou recomendações financeiras, de investimento, comerciais ou de outro tipo fornecidos ou endossados pela TradingView. Leia mais nos Termos de Uso.
Aviso legal
As informações e publicações não se destinam a ser, e não constituem, conselhos ou recomendações financeiras, de investimento, comerciais ou de outro tipo fornecidos ou endossados pela TradingView. Leia mais nos Termos de Uso.