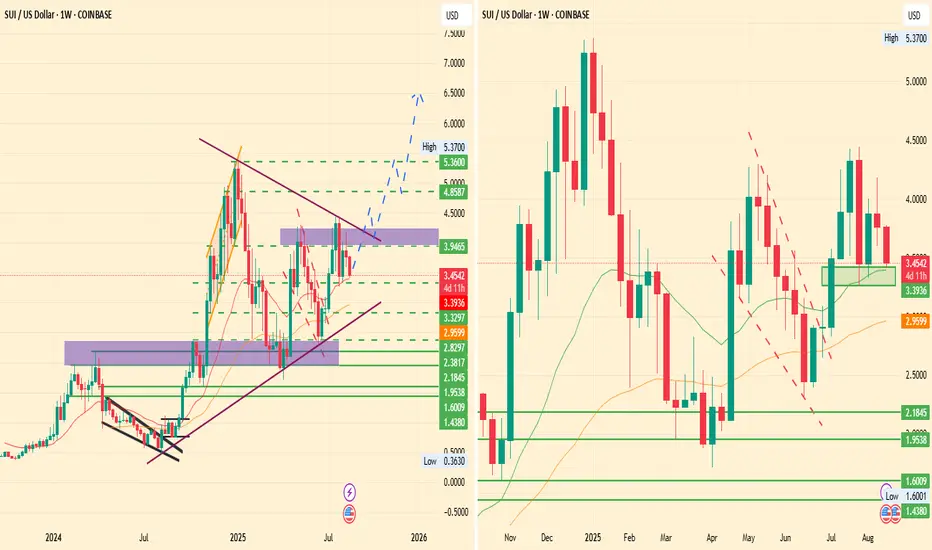
In the current quarter, July brought bullish demand, where this symmetrical pattern played its role on the weekly chart as the SUI price USD reflected a sharp rise from the lower border of this triangle to the upper edge, marking a 90% surge from $2.29 to $4.42.
Yet, August brought a pullback toward a key support level near $3.32. If this zone holds and bullish demand steps in, analysts anticipate a retest of the upper border of the pattern.
A successful breakout could send the SUI price forecast toward $5.37 in the coming weeks.
this retest in Q3 will be followed by an extended rally toward the $6.6 to $7.0 region in Q4 2025.
Aviso legal
As informações e publicações não devem ser e não constituem conselhos ou recomendações financeiras, de investimento, de negociação ou de qualquer outro tipo, fornecidas ou endossadas pela TradingView. Leia mais em Termos de uso.
Aviso legal
As informações e publicações não devem ser e não constituem conselhos ou recomendações financeiras, de investimento, de negociação ou de qualquer outro tipo, fornecidas ou endossadas pela TradingView. Leia mais em Termos de uso.