Shriram Transport Finance (D) - Head & Shoulders Chart Pattern
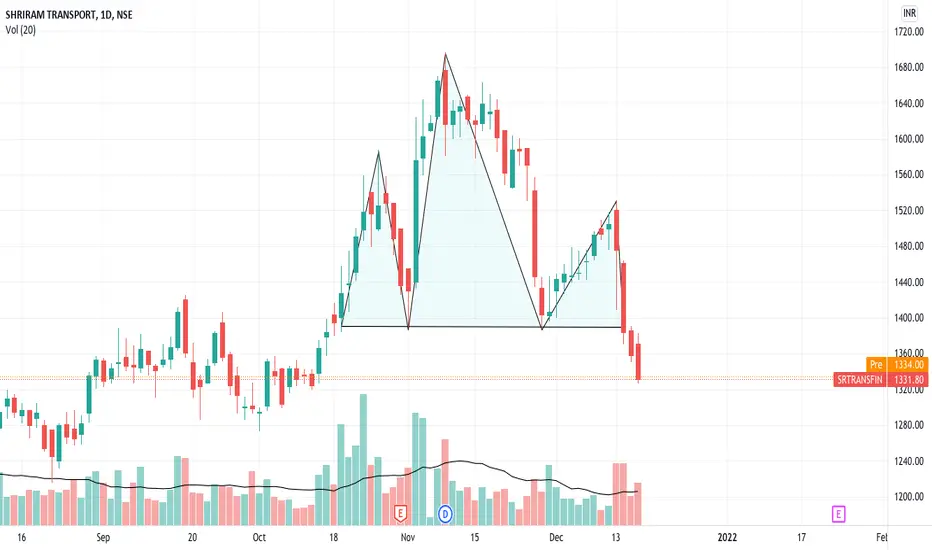
Shriram Transport Finance (Daily)
Head & Shoulders Chart Pattern
Lower bollinger band is challenged
MACD of the daily wave and weekly tide is downtick
RSI is below 40 in the oversold zone
Stochastic 14,3,3 is in negative crossover and oversold zone
-DI is above +DI and ADX is above 15 in the Directional Movement Index (DMI)
Seems to be in the C wave currently
Look for the next major support below on the chart as Target 1
Aviso legal
As informações e publicações não devem ser e não constituem conselhos ou recomendações financeiras, de investimento, de negociação ou de qualquer outro tipo, fornecidas ou endossadas pela TradingView. Leia mais em Termos de uso.
Aviso legal
As informações e publicações não devem ser e não constituem conselhos ou recomendações financeiras, de investimento, de negociação ou de qualquer outro tipo, fornecidas ou endossadas pela TradingView. Leia mais em Termos de uso.