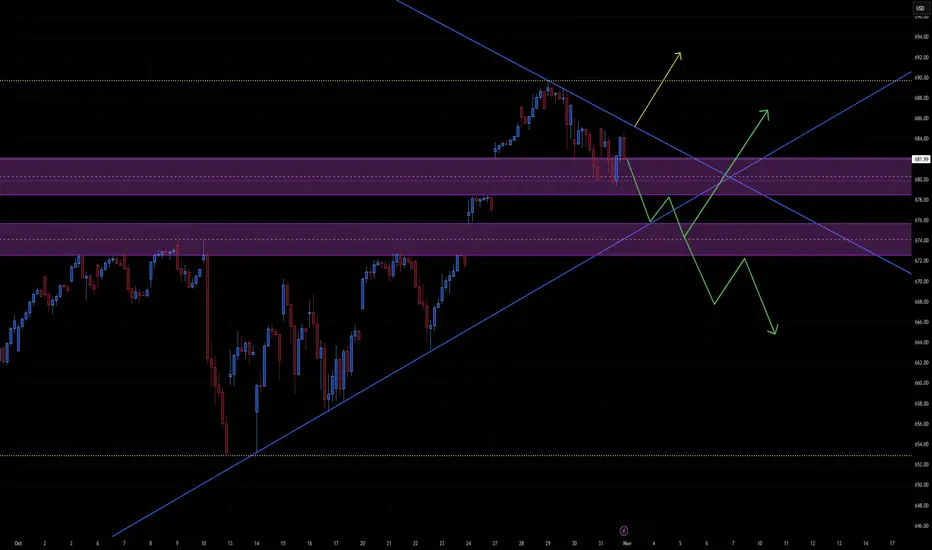
The chart shows SPY (S&P 500 ETF) with:
Descending resistance trendline from recent highs
Ascending support trendline from the October lows
Two horizontal demand/supply zones around 675–678 and 680–684
Potential breakout and breakdown paths (yellow and green arrows)
This suggests you’re analyzing a symmetrical triangle or descending channel meeting an ascending trend, which typically resolves with a directional breakout soon.
📈 Bullish Case (Yellow Path)
Setup:
Price currently around 681–682, testing the upper supply zone and descending trendline.
Confirmation Needed:
Break and close above 684–686 (top of purple zone and descending resistance)
Hold that level as new support
Target Zones:
690–692 — measured move from the triangle and prior local resistance
700+ — if momentum builds on macro catalysts (earnings, rates, etc.)
Bullish Catalysts:
VIX cooling off, risk-on sentiment
Strong earnings / dovish Fed remarks
Volume-supported breakout above 684
Invalidation:
Failure to hold above 678 after breakout retest
📉 Bearish Case (Green Path)
Setup:
Rejection from the 681–684 resistance area and continuation under descending resistance.
Confirmation Needed:
Breakdown below 676, invalidating the ascending support trendline
Lower high confirmation near 681
Target Zones:
670–672 — first reaction zone (lower purple band)
662–664 — measured move from descending wedge
650–654 — extended target (matches prior low and yellow dotted support)
Bearish Catalysts:
Rising yields or hawkish Fed tone
Weak labor/inflation data
Broad risk-off correction
Invalidation:
Break above 686–688 with volume
⚖️ Neutral Outlook (Next 2–3 Weeks)
SPY is coiling tightly between 676 and 684, and volatility compression suggests a breakout likely within 1–2 weeks.
The key pivot is 680–682: above it favors short-term bulls; below 676 shifts momentum bearish.
🧩 Summary Table
Bias Confirmation Short-term Target Stop/Invalidation Notes
Bullish Close above 684 690–692 <678 Momentum breakout scenario
Bearish Close below 676 670 → 662 >686 Breakdown from wedge
Neutral Range 676–684 — — Wait for breakout confirmation
Aviso legal
As informações e publicações não devem ser e não constituem conselhos ou recomendações financeiras, de investimento, de negociação ou de qualquer outro tipo, fornecidas ou endossadas pela TradingView. Leia mais em Termos de uso.
Aviso legal
As informações e publicações não devem ser e não constituem conselhos ou recomendações financeiras, de investimento, de negociação ou de qualquer outro tipo, fornecidas ou endossadas pela TradingView. Leia mais em Termos de uso.