I guess the reverse cup and handle I had drawn out on the 5 minute and one minute chart worked out too bad I did not have a put option in place. I would have recovered some of my losses chasing the rabbit on $ORCL. I'm not going to lie this market has me shook. I seriously prefer crypto. Participating in a market that is this effected by someone talking is ridiculous. What I am trying to learn is price action. I am also learning to use the 50 day Moving Average indicator. I am not fully comfortable. I have been able to use FIB retracement tool along with some other indicators whether it be a chat pattern or the MVA.
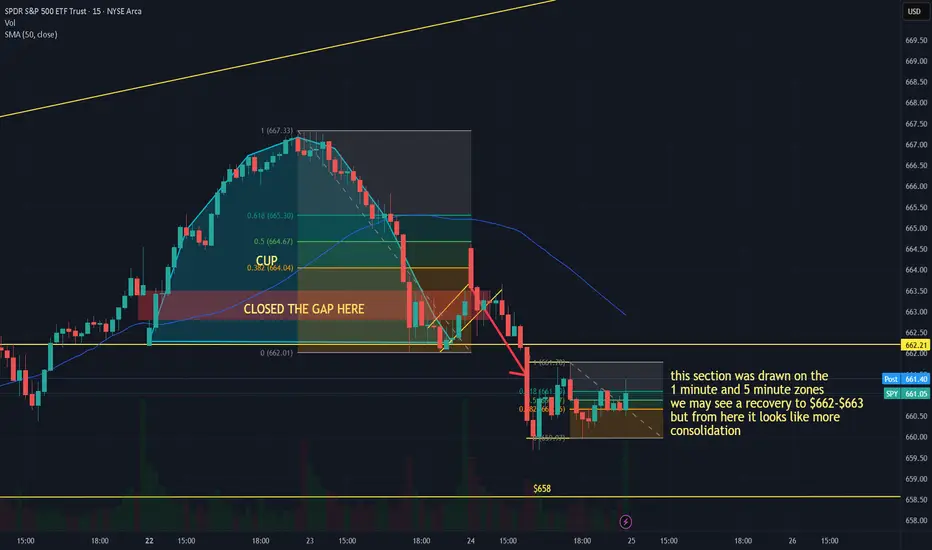
So, if you zoom in to the area where consolidation is taking place using the FIB retracement and support and resistance lines it may touch $662-$663. If it breaks out with a strong green candle we may have a recovery, but it breaks out lower below support with a strong red candle you will see a breakdown further down to previous supports $658, $654, $652.70 To close a big gap,
The reason I also say it may touch $662-$663 is because we should be tracking that the candles have to either bounce off of or tread about the 50-day MVA. So, either way there is money to be made but once this month and the holidays are through expect this to breakout much higher to $700 if trump gets his way. AKA Printer go BRRRRR. He's a master market manipulator and Perma bull
In the meantime, sit and wait for a good breakout I may have to exit my current position at a loss. Scary times we are living in. Get your life right with The Lord Jesus Christ.
AS ALWAYS THIS IS NOT FINANCIAL ADVICE, PURELY USING MY SELF-TAUGHT TECHNICAL ANALYSIS OF THE SITUATION. GODBLESS YOU ALL AND I PRAY YOU ALL HIT YOUR GOALS THIS MONTH.
Aviso legal
As informações e publicações não devem ser e não constituem conselhos ou recomendações financeiras, de investimento, de negociação ou de qualquer outro tipo, fornecidas ou endossadas pela TradingView. Leia mais em Termos de uso.
Aviso legal
As informações e publicações não devem ser e não constituem conselhos ou recomendações financeiras, de investimento, de negociação ou de qualquer outro tipo, fornecidas ou endossadas pela TradingView. Leia mais em Termos de uso.