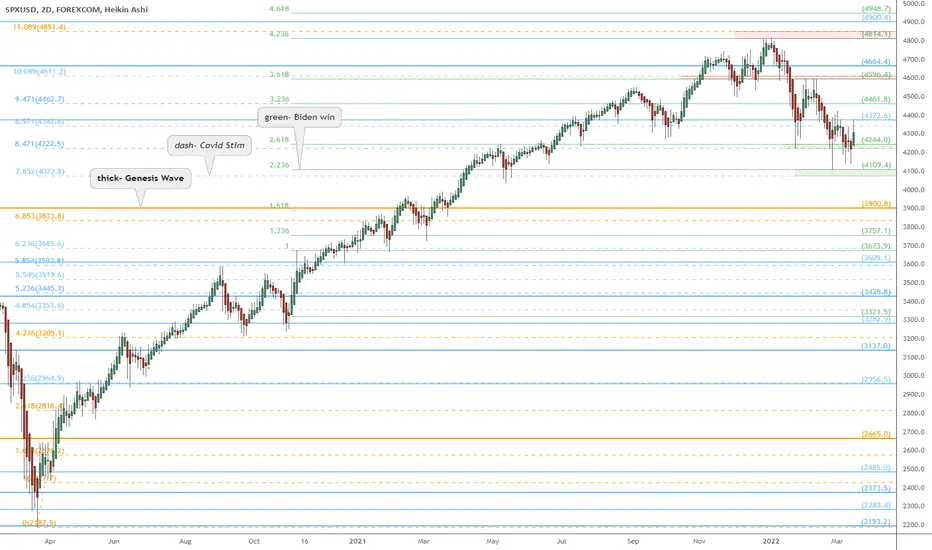
Plotted are 3 different sets of Fibonacci Extensions.
Each fib is like a "ruler" calibrated to a specific wave.
Every level is relevant, especially the confluence zones.
4372.6 is the key level to break and hold as bottom marker.
4343.6 is immediate support that strong bull would hold.
4222-4224 is key support for bulls to defend as a higher low.
4073-4019 should have been the bottom and NOT be retested.
For a closer look, check out this HOURLY view (click).
.
the Golden Ratio is my Religion
the Trading View is my Nation
the Moderator Tag is my Flag
the Trading View is my Nation
the Moderator Tag is my Flag
Publicações relacionadas
Aviso legal
As informações e publicações não devem ser e não constituem conselhos ou recomendações financeiras, de investimento, de negociação ou de qualquer outro tipo, fornecidas ou endossadas pela TradingView. Leia mais em Termos de uso.