Description:
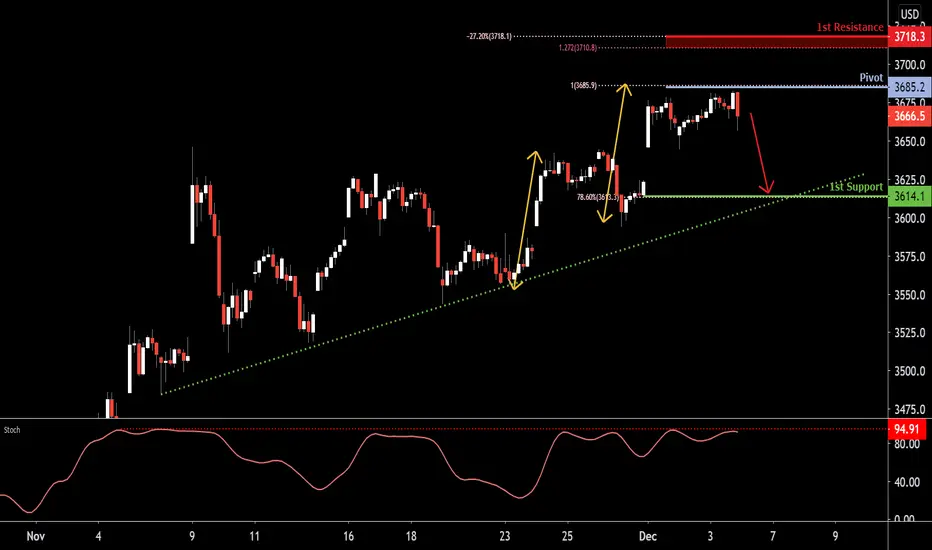
Price reacting and pulling back from recent swing high and Pivot at 3685.2. With RSI testing resistance where price reacted in the past, we see a low probability bearish scenario where price may drop towards ascending trendline support and 1st support at 3614.1. Otherwise, failure to hold below pivot should see price swing the other way towards Fibonacci confluence zone and 1st resistance at 3718.3
Pivot: 3685.2
Supporting Points:
100% Fibonacci extension, Graphical swing high resistance
1st Support: 3614.1
Supporting Points:
78.6% Fibonacci retracement, Ascending trendline support
1st Resistance: 3718.3
Supporting Points:
-27.2% Fibonacci retracement, 127.2% Fibonacci extension
Trading FX & CFDs carries high risk.
Aviso legal
As informações e publicações não devem ser e não constituem conselhos ou recomendações financeiras, de investimento, de negociação ou de qualquer outro tipo, fornecidas ou endossadas pela TradingView. Leia mais em Termos de uso.
Aviso legal
As informações e publicações não devem ser e não constituem conselhos ou recomendações financeiras, de investimento, de negociação ou de qualquer outro tipo, fornecidas ou endossadas pela TradingView. Leia mais em Termos de uso.