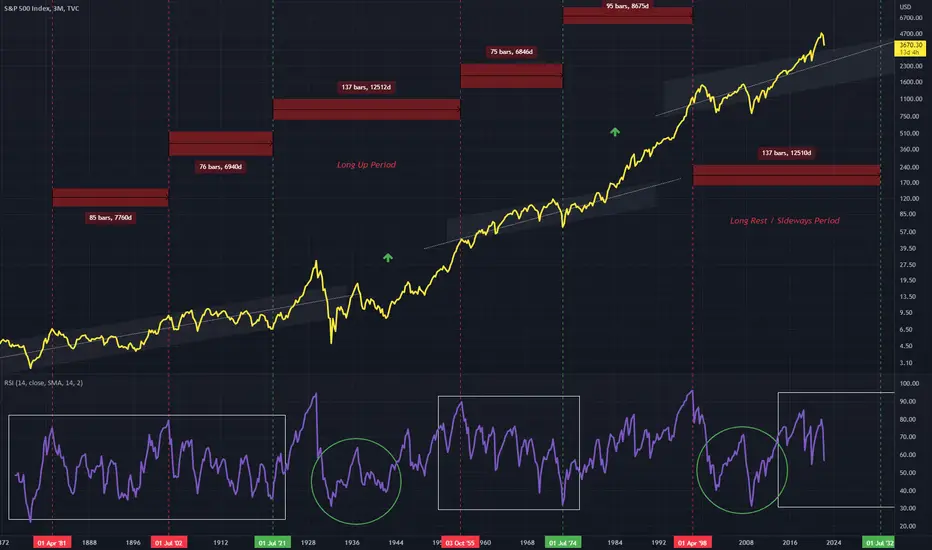
Two periods can be observed on the RSI for SPX on this 3Monthly chart
A downward trend which correlates with a sideways move on the relative timeframe
And a small uptrend that correlates with sharper growth on the SPX, these begin within the green circle
These green circles show very comparative structures, however one is during an up period, while the current one is during a sideways trend period
Price will very likely continue through the up channel on this larger timeframe
Aviso legal
As informações e publicações não devem ser e não constituem conselhos ou recomendações financeiras, de investimento, de negociação ou de qualquer outro tipo, fornecidas ou endossadas pela TradingView. Leia mais em Termos de uso.
Aviso legal
As informações e publicações não devem ser e não constituem conselhos ou recomendações financeiras, de investimento, de negociação ou de qualquer outro tipo, fornecidas ou endossadas pela TradingView. Leia mais em Termos de uso.