SOL/USD Technical Review
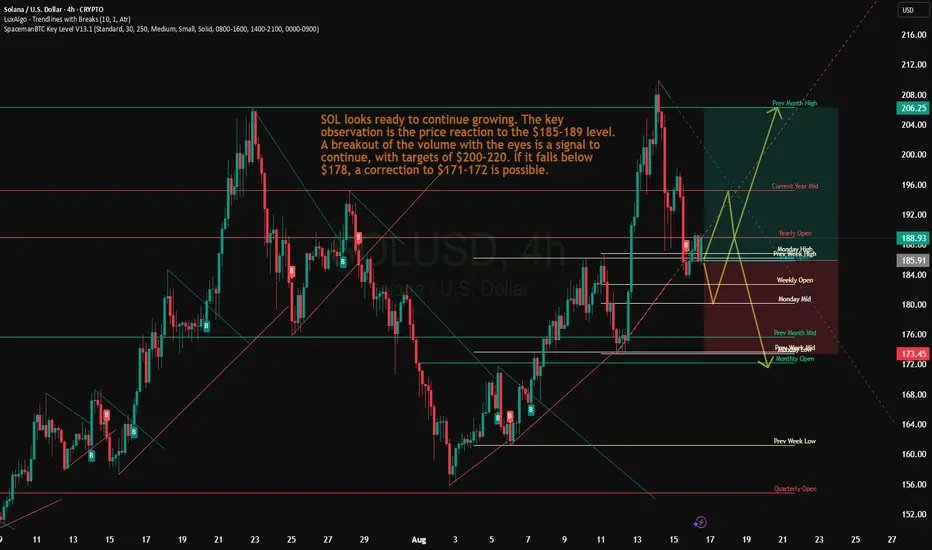
Support around $178 (20-day EMA) is holding the price, indicating high buying interest.
The key resistance level is $185–$189. A breakout of this range will open the way to targets of $200–206, possibly even $220 if the momentum continues.
Pattern formation: an upward reversal from the $160 zone (lower Bollinger band + Fibonacci) is recorded, which completes the ABC correction and launches a new wave impulse. Upside potential is towards $180.
Trend and on-chain indicators: a decrease in the balance on exchanges, an increase in TVL and growing institutional interest (ETF) create a solid base for moving higher.
Trade fechado: stop atingido
Take Profit 1 reachedNota
TP 2Publicações relacionadas
Aviso legal
As informações e publicações não devem ser e não constituem conselhos ou recomendações financeiras, de investimento, de negociação ou de qualquer outro tipo, fornecidas ou endossadas pela TradingView. Leia mais em Termos de uso.
Publicações relacionadas
Aviso legal
As informações e publicações não devem ser e não constituem conselhos ou recomendações financeiras, de investimento, de negociação ou de qualquer outro tipo, fornecidas ou endossadas pela TradingView. Leia mais em Termos de uso.