SMC Global Securities – Breakout Build-up with Volume Expansion
 SMCGLOBAL
📈Pattern & Setup:
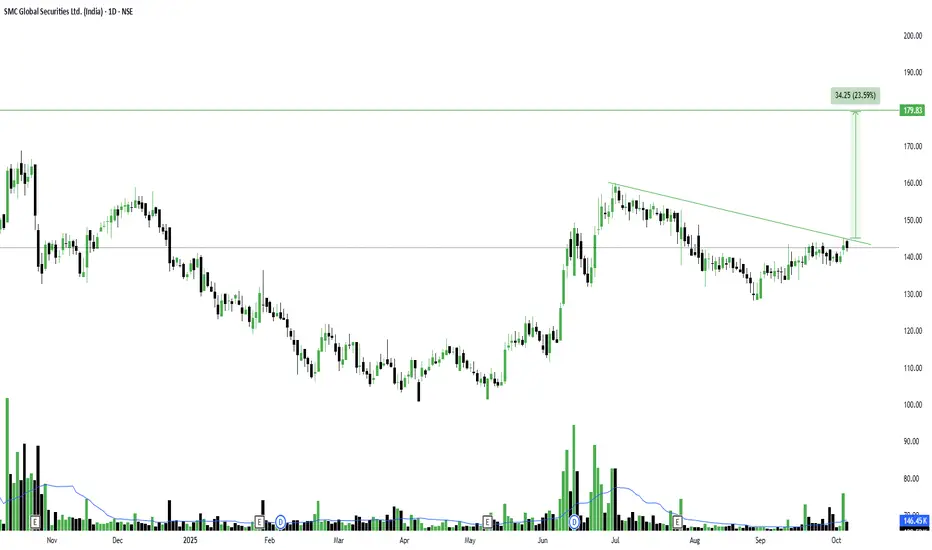
SMC Global Securities is currently showing a descending trendline breakout pattern on the daily chart. After months of sideways consolidation, the stock has started moving up with steady buying volume near the trendline resistance.
The structure resembles a falling channel breakout in progress, which usually indicates a trend reversal from down to up. Volume has recently picked up — a positive sign that accumulation might be underway.
If the stock manages a close above 147–150, it could trigger a quick rally toward 170–180 zones. The breakout zone aligns well with previous supply, making it an important level to watch.
📝 Trade Plan:
Entry: Above 148–150 with strong volume confirmation.
🚩Stop-Loss: 138 (below near-term support).
🎯Targets:
Target 1 → 165 (short-term resistance).
Target 2 → 180 (measured move target, ~23% upside).
💡Pyramiding Strategy:
1. Enter initial 50% position above 148 breakout.
2. Add the remaining once price sustains above 155.
3. Trail stop-loss to 145 once price crosses 160.
🧠Logic Behind Selecting this Trade:
The stock has shown steady recovery from its base with multiple higher lows, signaling strength returning. The descending trendline has acted as a cap for months — a breakout here with volume can open the door for a fresh short-term uptrend.
Keep Learning. Keep Earning.
Let’s grow together 📚🎯
🔴Disclaimer:
This analysis is for educational purposes only. Not a buy/sell recommendation. Please consult your financial advisor before making any investment or trading decisions.
📈Pattern & Setup:
SMC Global Securities is currently showing a descending trendline breakout pattern on the daily chart. After months of sideways consolidation, the stock has started moving up with steady buying volume near the trendline resistance.
The structure resembles a falling channel breakout in progress, which usually indicates a trend reversal from down to up. Volume has recently picked up — a positive sign that accumulation might be underway.
If the stock manages a close above 147–150, it could trigger a quick rally toward 170–180 zones. The breakout zone aligns well with previous supply, making it an important level to watch.
📝 Trade Plan:
Entry: Above 148–150 with strong volume confirmation.
🚩Stop-Loss: 138 (below near-term support).
🎯Targets:
Target 1 → 165 (short-term resistance).
Target 2 → 180 (measured move target, ~23% upside).
💡Pyramiding Strategy:
1. Enter initial 50% position above 148 breakout.
2. Add the remaining once price sustains above 155.
3. Trail stop-loss to 145 once price crosses 160.
🧠Logic Behind Selecting this Trade:
The stock has shown steady recovery from its base with multiple higher lows, signaling strength returning. The descending trendline has acted as a cap for months — a breakout here with volume can open the door for a fresh short-term uptrend.
Keep Learning. Keep Earning.
Let’s grow together 📚🎯
🔴Disclaimer:
This analysis is for educational purposes only. Not a buy/sell recommendation. Please consult your financial advisor before making any investment or trading decisions.
TrendX INC
Publicações relacionadas
Aviso legal
As informações e publicações não se destinam a ser, e não constituem, conselhos ou recomendações financeiras, de investimento, comerciais ou de outro tipo fornecidos ou endossados pela TradingView. Leia mais nos Termos de Uso.
TrendX INC
Publicações relacionadas
Aviso legal
As informações e publicações não se destinam a ser, e não constituem, conselhos ou recomendações financeiras, de investimento, comerciais ou de outro tipo fornecidos ou endossados pela TradingView. Leia mais nos Termos de Uso.