SLDB Fib. & Chart Update:
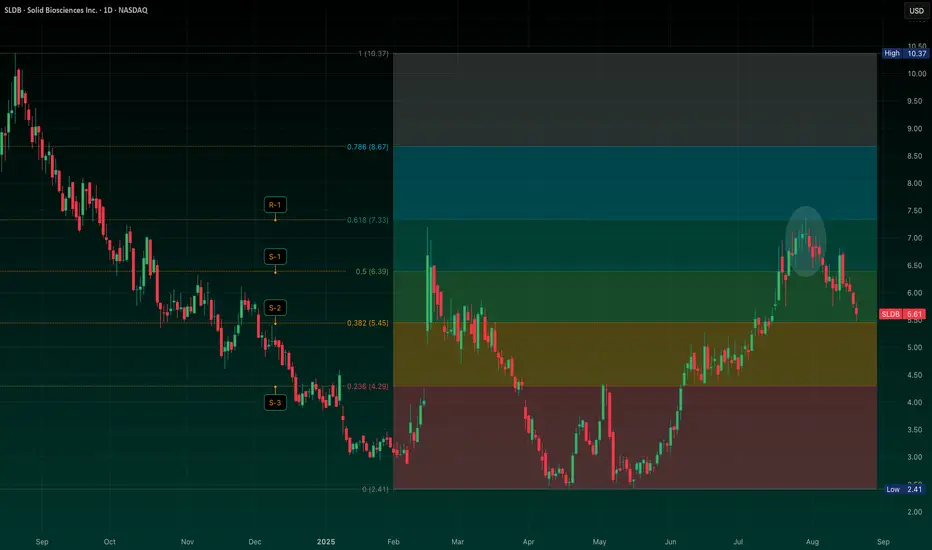
As flagged in my earlier post (Aug 4), weakness was expected absent fresh catalysts. The chart is now sitting around the 0.382 Fib retrace (~$5.45) -- a key support zone, IMO.
If this level doesn’t hold, the next downside marker lines up near the 0.236 (~$4.29). On the flip side, stabilization here would keep the prior breakout structure intact.
Nothing’s changed on the fundamental side since ER, so price action is doing the heavy lifting. And with the broader market showing signs of rolling over, sellers may press harder if this level cracks.
This is the spot where the tape either finds footing or breaks lower into the next leg. Stay tuned and GLTA.
Aviso legal
As informações e publicações não se destinam a ser, e não constituem, conselhos ou recomendações financeiras, de investimento, comerciais ou de outro tipo fornecidos ou endossados pela TradingView. Leia mais nos Termos de Uso.
Aviso legal
As informações e publicações não se destinam a ser, e não constituem, conselhos ou recomendações financeiras, de investimento, comerciais ou de outro tipo fornecidos ou endossados pela TradingView. Leia mais nos Termos de Uso.