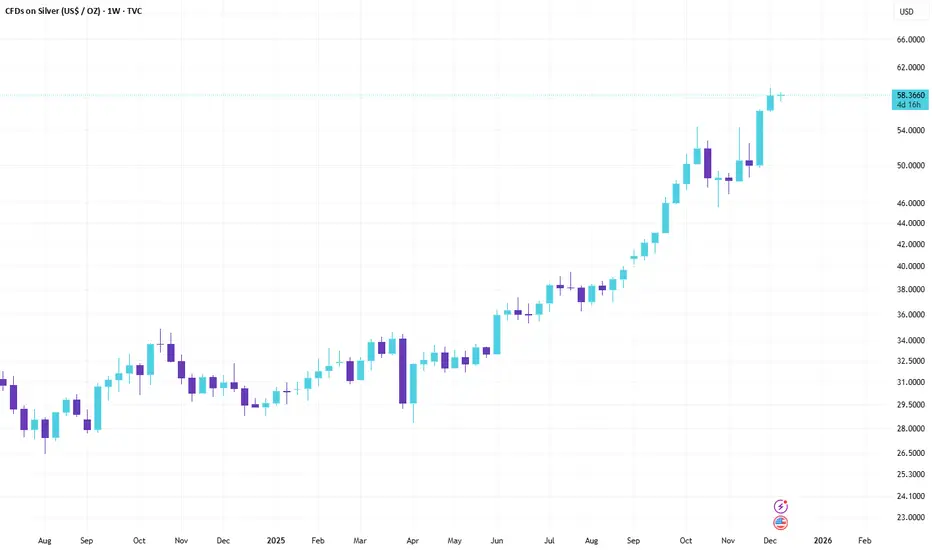
Real-Time XAG/USD Chart Analysis: Bullish Momentum Builds Toward $60
As of December 8, 2025 (Intraday: Early Trading)
Current Price: 58.31 USD (Down ~0.08% from previous close of 58.36; trading range: 57.59–58.74)
Asset: XAG/USD (Silver Spot vs. US Dollar)
Key Context: Silver's consolidating just shy of its all-time high of 59.42 hit earlier this week, with fresh ETF inflows and tightening physical inventories underscoring the uptrend. Amid Fed rate-cut bets and robust industrial demand (solar, AI), the technical setup leans Strong Buy—a pullback could be a gift for longs eyeing new records.
Quick Macro Snapshot
Tailwinds: Weaker USD from softer PCE inflation and labor data, plus record SLV ETF inflows (highest in 10 years). Supply crunch on Shanghai exchanges at multi-year lows, with green tech demand projected to drive deficits. Silver's 2025 YTD gains now at ~83%, outpacing gold's rally.
Headwinds: Overstretched speculative positioning could spark profit-taking; hawkish Fed signals next week might cap upside if yields rebound.
Technical Breakdown
Pulling from daily and 4H charts, the bias is firmly bullish despite minor intraday dips:
Trend & Moving Averages (Strong Buy):
Daily: Price well above rising 200-day EMA (~55.00) and 50-day EMA (~50.00), with all major MAs aligned bullish. 200-hour EMA at 56.30 provides dynamic support.
4H: Golden cross intact on EMAs; buyers defending the ascending channel.
Implication: Uptrend channel from October lows holding; retest of $59+ imminent on volume pickup.
Momentum Indicators (Neutral with Bullish Tilt):
RSI (14): 50.82 (Neutral)—cooled from overbought but no divergence yet, leaving room for extension.
MACD (12,26): Recently slipped negative below zero line (bearish histogram), signaling short-term downside momentum, but line still above signal overall.
Stochastics (9,6): ~65 (Buy territory); not overbought.
CCI (14): Neutral (~0); Williams %R: -45 (Mild buy).
ADX (14): 28 (Moderate trend strength, bullish direction).
Implication: Momentum pausing after the ATH push, but neutral RSI avoids sell signals—watch for bullish crossover.
Volume & Volatility:
ATR (14): ~0.85 (Elevated vs. recent avg., indicating volatility spike post-breakout).
Bull/Bear Power: Bulls dominant (+0.45), with options flow heavy on calls.
Pivot Points & Key Levels (Classic):LevelPriceTypeR359.50ResistanceR259.20ResistanceR159.00ResistancePivot58.15NeutralS157.50SupportS256.50SupportS356.20Support
Support Cluster: 56.20–56.50 (200h EMA + key zone; break below eyes 55.25 weekly support).
Resistance: 59.00–59.35 (recent ATH; clear for $60+ push).
Fibonacci: 61.8% extension from Oct lows targets 60.50.
Weekly Outlook
Broader uptrend: Strong Buy on MAs; Triangle pattern resolving higher, with potential test of 55.25 support before rally to 60.65–68.05. YTD doubling makes $65 realistic if Fed cuts materialize.
Risk: Drop below 56.20 could accelerate to 54–55 (prior resistance-turned-support), but low probability amid deficit forecasts.
Bias: Buy the dip—industrial tailwinds and ETF momentum point to $60 by quarter-end.
Trade Takeaway: Long above 58.15 pivot (stop below 56.50). Target R1 at 59.00 for 1:2 risk/reward. Squad, silver's stealing gold's thunder—$60 next, or Fed-induced pause? What's your play? #XAG #SilverAnalysis #SignalSquad
Aviso legal
As informações e publicações não se destinam a ser, e não constituem, conselhos ou recomendações financeiras, de investimento, comerciais ou de outro tipo fornecidos ou endossados pela TradingView. Leia mais nos Termos de Uso.
Aviso legal
As informações e publicações não se destinam a ser, e não constituem, conselhos ou recomendações financeiras, de investimento, comerciais ou de outro tipo fornecidos ou endossados pela TradingView. Leia mais nos Termos de Uso.