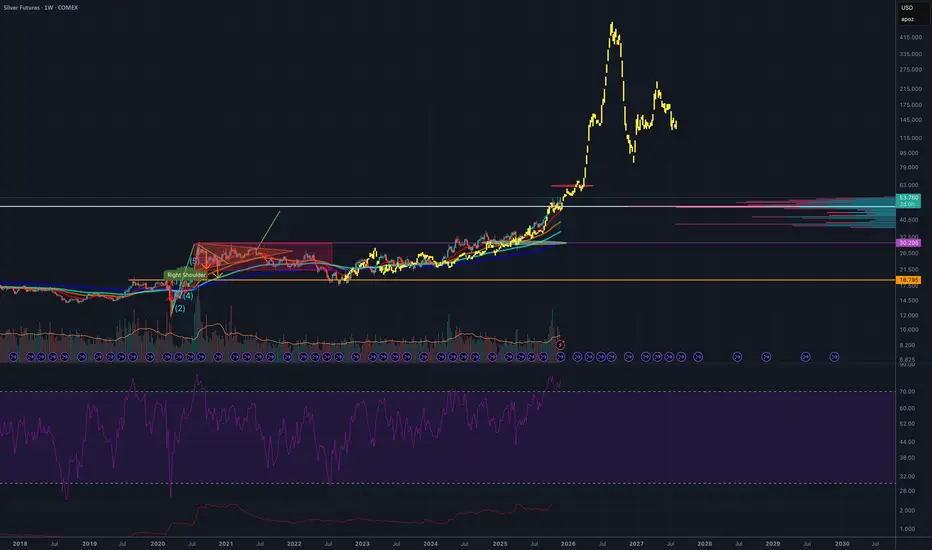
A technical analysis chart that overlays the 1970s silver breakout pattern onto the projected price action for 2025. The chart illustrates how the historical parabolic move that silver experienced during the late-1970s bull cycle could repeat in a modern context. By aligning the timeframes and scaling the price structures, the chart highlights a potential breakout setup forming in 2025 that mirrors the earlier pattern. This visual comparison is used to infer a possible target price for 2026 based on the magnitude and trajectory of the 1970s rally, offering a speculative projection grounded in historical market behavior.
Aviso legal
As informações e publicações não se destinam a ser, e não constituem, conselhos ou recomendações financeiras, de investimento, comerciais ou de outro tipo fornecidos ou endossados pela TradingView. Leia mais nos Termos de Uso.
Aviso legal
As informações e publicações não se destinam a ser, e não constituem, conselhos ou recomendações financeiras, de investimento, comerciais ou de outro tipo fornecidos ou endossados pela TradingView. Leia mais nos Termos de Uso.