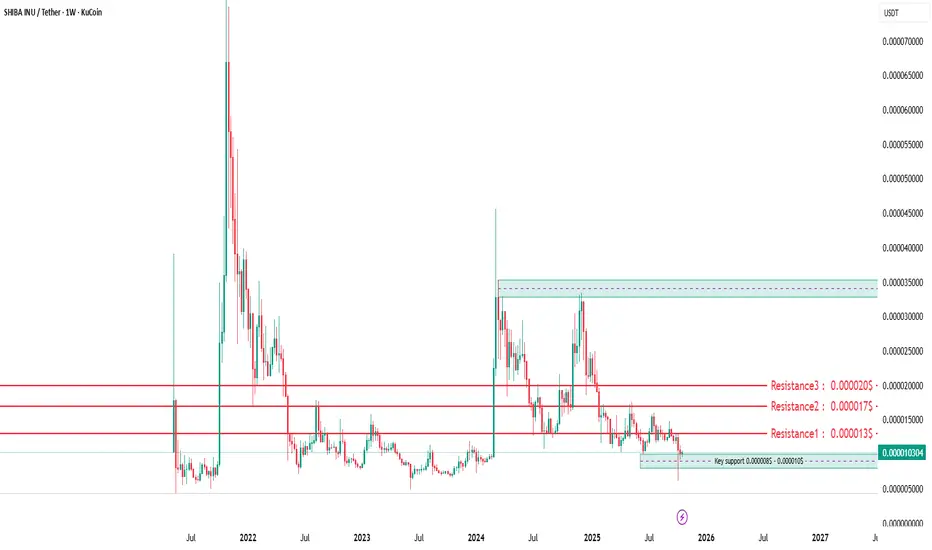
Shiba Inu is still in a long-term accumulation phase, moving sideways after its huge 2021 spike. The price has been consolidating between 0.000006 and 0.000018 for almost two years.
Key Observations:
Major Support Zone: 0.000008–0.000009 — this is the area where long-term buyers usually step in.
Resistance Zone: 0.000017–0.000020 — strong selling pressure every time price touches this zone.
The chart shows multiple “mini-rallies” that failed to hold above resistance — a typical pattern before a breakout.
Volume is relatively low but steady, indicating smart money accumulation at the bottom.
If SHIB breaks and holds above 0.000012, the next key target zone is 0.000017–0.000020, followed by 0.000028 in a strong bullish wave.
📊 Short-Term (Daily Timeframe)
Currently, SHIB is hovering around 0.000010, very close to a historical support level.
Technical Insights:
The market has printed several long wicks to the downside, showing buyers defending the support zone.
A descending triangle seems to be forming — which can break either way, but considering the low volatility, the probability of a false breakdown then a sharp recovery is high.
RSI is near oversold territory, and momentum is flat → potential energy buildup for a move.
Important Levels:
Support: 0.0000095 – 0.0000100
Immediate Resistance: 0.0000125
Breakout Confirmation: Above 0.0000130 (strong volume required)
🚀 Possible Scenarios
Scenario Description Targets
🟢 Bullish Reversal Bounce from 0.000010 + breakout above 0.000013 0.000017 → 0.000020 → 0.000028
🔴 Bearish Continuation Break below 0.000009 0.000007 → 0.000006
⚪ Neutral Range Sideways between 0.000009–0.000012 Accumulation phase continues
💬 Summary (for showing off 😏)
“SHIB is sitting on a long-term accumulation zone around 0.000010. Price compression and flat momentum suggest a big move is coming — a breakout above 0.000013 could start a new rally toward 0.00002 and beyond.”
Aviso legal
As informações e publicações não devem ser e não constituem conselhos ou recomendações financeiras, de investimento, de negociação ou de qualquer outro tipo, fornecidas ou endossadas pela TradingView. Leia mais em Termos de uso.
Aviso legal
As informações e publicações não devem ser e não constituem conselhos ou recomendações financeiras, de investimento, de negociação ou de qualquer outro tipo, fornecidas ou endossadas pela TradingView. Leia mais em Termos de uso.