Asset: Sharda Cropchem Ltd (SHARDACROP)
Breakout Level: 657
Potential Target: 760
Stop Loss: 622
Timeframe: Short to Medium term
Risk to Reward ratio : 1:2.7
Rationale:
Fundamentals -
Fundamentally decent stock with the following attributes:
* ROCE - 19.3%
* ROE - 12.8%
* Debt to Equity - 0
* Stock PE 19.3 / Industry PE - 29.5 || Stock PBV 2.35 / Industry PBV 2.5 - Company is underpriced
* EPS / Revenue - Increasing over last 6 months
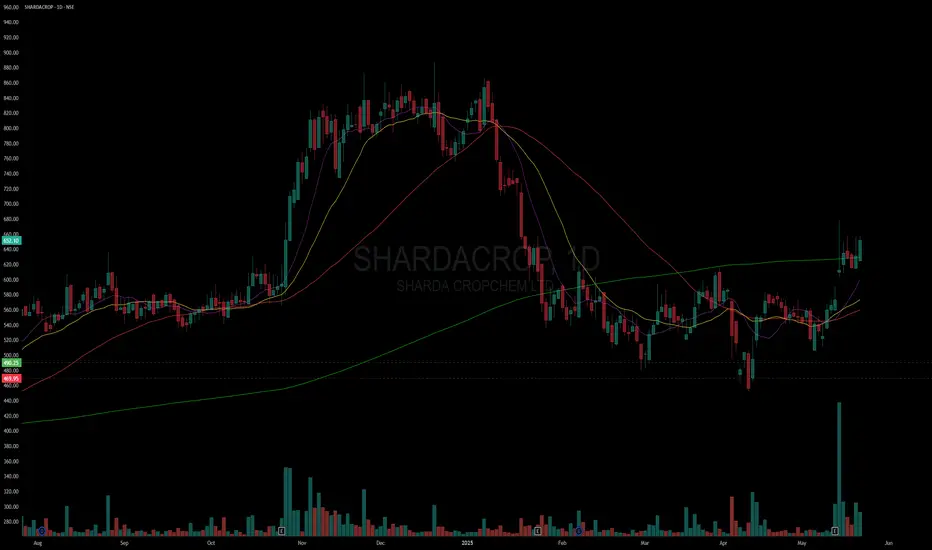
Technicals -
* Overall structure - Forming a large cup on weekly charts
* Multiple timeframe analysis - Stock poised for up move as the daily / weekly / monthly charts are showing formation of a cup (over 5 months)
* On daily charts, the price surged ~3.3% yesterday and surfing the 200 DMA
* The 10 DMA is above the 20 DMA and hints towards continued up move
* Increasing momentum / RS
* ADR 5.5%
Market analysis
* Forecasted for ~33% further increase
* Promoter holding high at 74.82% and remains steady
* FIIs increasing holding
* MFs and DIIs are increasing stake
* Retail reducing
Cons
* Considering that the price has gapped up, there could be some pull back but overall structure of the 200 DMA line remains up
This analysis is for educational purposes only and should not be considered as financial advice. Trading and investing in financial markets involve significant risk, and past performance is not indicative of future results. You should conduct your own research and consult with a qualified financial advisor before making any trading or investment decisions. The author is not responsible for any financial losses or damages that may result from the use of this information.
Breakout Level: 657
Potential Target: 760
Stop Loss: 622
Timeframe: Short to Medium term
Risk to Reward ratio : 1:2.7
Rationale:
Fundamentals -
Fundamentally decent stock with the following attributes:
* ROCE - 19.3%
* ROE - 12.8%
* Debt to Equity - 0
* Stock PE 19.3 / Industry PE - 29.5 || Stock PBV 2.35 / Industry PBV 2.5 - Company is underpriced
* EPS / Revenue - Increasing over last 6 months
Technicals -
* Overall structure - Forming a large cup on weekly charts
* Multiple timeframe analysis - Stock poised for up move as the daily / weekly / monthly charts are showing formation of a cup (over 5 months)
* On daily charts, the price surged ~3.3% yesterday and surfing the 200 DMA
* The 10 DMA is above the 20 DMA and hints towards continued up move
* Increasing momentum / RS
* ADR 5.5%
Market analysis
* Forecasted for ~33% further increase
* Promoter holding high at 74.82% and remains steady
* FIIs increasing holding
* MFs and DIIs are increasing stake
* Retail reducing
Cons
* Considering that the price has gapped up, there could be some pull back but overall structure of the 200 DMA line remains up
This analysis is for educational purposes only and should not be considered as financial advice. Trading and investing in financial markets involve significant risk, and past performance is not indicative of future results. You should conduct your own research and consult with a qualified financial advisor before making any trading or investment decisions. The author is not responsible for any financial losses or damages that may result from the use of this information.
Trade ativo
Up 13% from where it was identified. Trade fechado: objetivo atingido
Up 23% from where it was identified.Aviso legal
As informações e publicações não devem ser e não constituem conselhos ou recomendações financeiras, de investimento, de negociação ou de qualquer outro tipo, fornecidas ou endossadas pela TradingView. Leia mais em Termos de uso.
Aviso legal
As informações e publicações não devem ser e não constituem conselhos ou recomendações financeiras, de investimento, de negociação ou de qualquer outro tipo, fornecidas ou endossadas pela TradingView. Leia mais em Termos de uso.