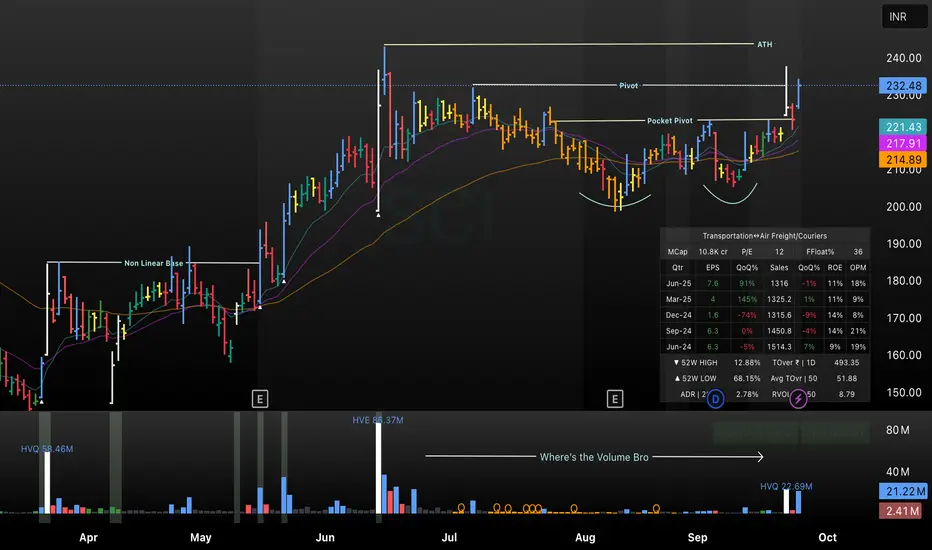
This TradingView chart of SCI highlights a non-linear base formation followed by a powerful pocket pivot and a breakout to all-time highs (ATH) in September 2025. The annotated chart showcases key technical structures: a pivot, pocket pivot level, and the ATH breakout, along with the moving averages (EMA 10, 20, 50). Volume analysis points to a “Where’s the Volume?” zone before the breakout. A mini fundamental dashboard displays quarterly financials and sector statistics, providing a holistic setup for position or swing traders.
Aviso legal
As informações e publicações não devem ser e não constituem conselhos ou recomendações financeiras, de investimento, de negociação ou de qualquer outro tipo, fornecidas ou endossadas pela TradingView. Leia mais em Termos de uso.
Aviso legal
As informações e publicações não devem ser e não constituem conselhos ou recomendações financeiras, de investimento, de negociação ou de qualquer outro tipo, fornecidas ou endossadas pela TradingView. Leia mais em Termos de uso.