Viés de alta
Technical Analysis: Symmetrical Triangle Breakout in SBICARD
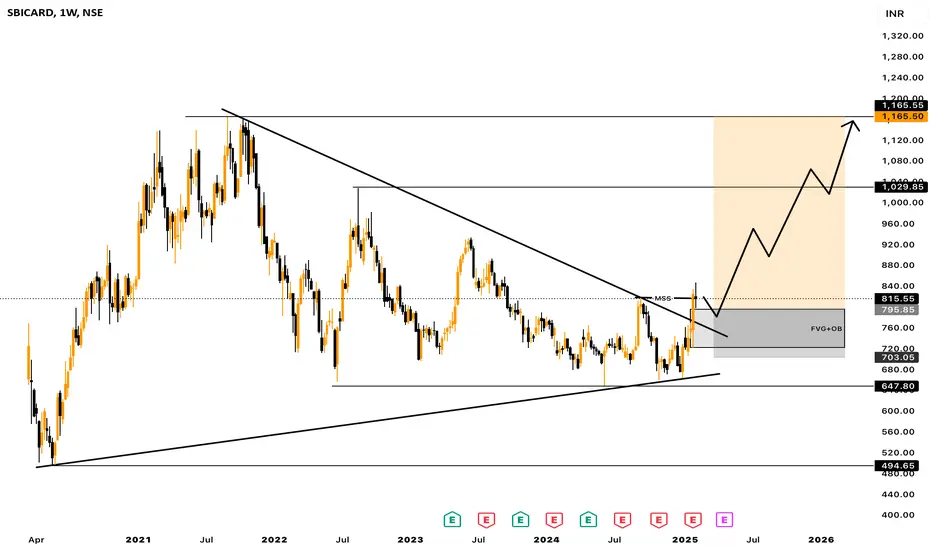
• The weekly chart of SBI Cards (SBICARD) shows a symmetrical triangle pattern that has been forming since mid-2021.
• The stock recently broke out of this pattern, indicating a potential trend reversal or continuation move depending on broader market conditions.
• Resistance Breakout: The upper trendline, which acted as resistance, has been breached, and the stock is now retesting the breakout level (~800).
• Volume Confirmation Needed: To validate the breakout, an increase in volume would be ideal.
Fundamental Analysis: Mixed Earnings Performance
• Earnings Per Share (EPS) Trends:
• Q3 FY24 EPS came in at 4.25, missing estimates by 31.16%—a significant negative surprise.
• Q2 FY24 EPS also missed estimates by 4.51%, while Q1 FY24 had a 4.59% miss as well.
• The company has shown inconsistent earnings, which could cause volatility despite the technical breakout.
• Revenue Growth:
• Q3 FY24 revenue was ₹46.19B, exceeding estimates by 10.06%.
• Q2 FY24 revenue missed expectations by 3.01%, while Q1 FY24 was also slightly weak.
• This suggests that while top-line growth is strong, profitability (EPS) is under pressure due to either higher costs or operational inefficiencies.
Investment View: Cautious Buy with Risk Management
• Technical View: The breakout above the triangle is bullish, but the stock must sustain above 800-820 for confirmation. If it does, next resistance levels are 900 and 1000.
• Fundamental Concerns: Weak earnings growth is a risk factor. The next earnings (April 2025) will be crucial.
• Buying Strategy:
• Entry: If the stock holds above 800-820, it can be bought with a target of 900-1000.
• Stop Loss: 750-770 zone (below the breakout trendline).
• Risk Factor: If broader market sentiment weakens or earnings disappoint further, the breakout might fail.
Conclusion: A breakout trade is valid, but weak earnings make it a cautious buy with a tight stop loss. If fundamentals improve, the rally could sustain.
Aviso legal
As informações e publicações não se destinam a ser, e não constituem, conselhos ou recomendações financeiras, de investimento, comerciais ou de outro tipo fornecidos ou endossados pela TradingView. Leia mais nos Termos de Uso.
Aviso legal
As informações e publicações não se destinam a ser, e não constituem, conselhos ou recomendações financeiras, de investimento, comerciais ou de outro tipo fornecidos ou endossados pela TradingView. Leia mais nos Termos de Uso.