SAIL is seen sustaining breakout of 17-year downtrend channel
SAIL is seen sustaining the breaking out of a 17-year downtrend channel on monthly charts, signaling a potentially powerful long-term reversal.
📈 Steel Authority of India (SAIL): Breaking Free from a 17-Year Technical Grip
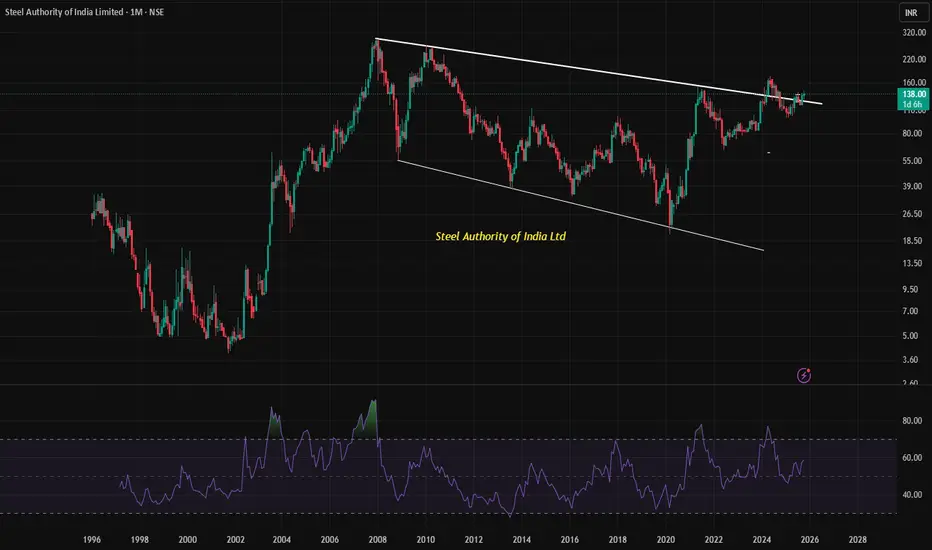
Steel Authority of India Ltd. (SAIL), one of India’s largest steel producers, is currently trading around ₹138.80 and showing signs of a major technical breakout. What makes this move noteworthy is that it’s emerging from a downward-sloping channel that has persisted since 2007–2008, spanning nearly 17 years. A breakout from such a long-term pattern is rare and often carries significant implications for future price action.
🔍 Understanding the Downtrend Channel
A downtrend channel is formed when a stock consistently makes lower highs and lower lows, bounded by parallel trendlines. For SAIL, this channel has defined its price movement for over a decade, acting as a ceiling that repeatedly rejected upward momentum. Breaking above this channel suggests a shift in market sentiment—from bearish to bullish.
📊 Monthly Chart Breakout: Why It Matters
Timeframe strength: Monthly chart breakouts are considered more reliable than daily or weekly ones because they reflect long-term investor behavior.
Volume confirmation: Sustained breakout levels often coincide with increased trading volume, indicating institutional interest.
Psychological shift: Surpassing a multi-year resistance level can trigger a wave of buying from traders who were previously cautious.
📈 Technical Indicators Support the Move
According to recent technical analysis:
📊 RSI Confirms Strength
The Relative Strength Index (RSI), a key momentum indicator, is currently moving in the 50–70 range, with recent readings around 58.42. This range is considered a bullish zone, indicating that buying momentum is building without the stock being overbought. Sustained RSI levels above 50 often precede further upward movement, especially when aligned with a breakout.
Price is above both 50-day and 200-day SMAs, reinforcing the strength of the breakout.
These indicators collectively suggest that the breakout is not just a short-term anomaly but part of a broader trend reversal.
🧠 Investor Takeaway
SAIL’s breakout from a 17-year downtrend channel is a textbook example of a long-term technical reversal. With supporting indicators like RSI, MACD, and moving averages aligning in favor of bulls, this move could mark the beginning of a sustained uptrend. Traders and investors may consider this a strong technical setup, but should also factor in macroeconomic conditions and sector fundamentals before making decisions.
Live chart Example
📈 Steel Authority of India (SAIL): Breaking Free from a 17-Year Technical Grip
Steel Authority of India Ltd. (SAIL), one of India’s largest steel producers, is currently trading around ₹138.80 and showing signs of a major technical breakout. What makes this move noteworthy is that it’s emerging from a downward-sloping channel that has persisted since 2007–2008, spanning nearly 17 years. A breakout from such a long-term pattern is rare and often carries significant implications for future price action.
🔍 Understanding the Downtrend Channel
A downtrend channel is formed when a stock consistently makes lower highs and lower lows, bounded by parallel trendlines. For SAIL, this channel has defined its price movement for over a decade, acting as a ceiling that repeatedly rejected upward momentum. Breaking above this channel suggests a shift in market sentiment—from bearish to bullish.
📊 Monthly Chart Breakout: Why It Matters
Timeframe strength: Monthly chart breakouts are considered more reliable than daily or weekly ones because they reflect long-term investor behavior.
Volume confirmation: Sustained breakout levels often coincide with increased trading volume, indicating institutional interest.
Psychological shift: Surpassing a multi-year resistance level can trigger a wave of buying from traders who were previously cautious.
📈 Technical Indicators Support the Move
According to recent technical analysis:
📊 RSI Confirms Strength
The Relative Strength Index (RSI), a key momentum indicator, is currently moving in the 50–70 range, with recent readings around 58.42. This range is considered a bullish zone, indicating that buying momentum is building without the stock being overbought. Sustained RSI levels above 50 often precede further upward movement, especially when aligned with a breakout.
Price is above both 50-day and 200-day SMAs, reinforcing the strength of the breakout.
These indicators collectively suggest that the breakout is not just a short-term anomaly but part of a broader trend reversal.
🧠 Investor Takeaway
SAIL’s breakout from a 17-year downtrend channel is a textbook example of a long-term technical reversal. With supporting indicators like RSI, MACD, and moving averages aligning in favor of bulls, this move could mark the beginning of a sustained uptrend. Traders and investors may consider this a strong technical setup, but should also factor in macroeconomic conditions and sector fundamentals before making decisions.
Live chart Example
Aviso legal
As informações e publicações não devem ser e não constituem conselhos ou recomendações financeiras, de investimento, de negociação ou de qualquer outro tipo, fornecidas ou endossadas pela TradingView. Leia mais em Termos de uso.
Aviso legal
As informações e publicações não devem ser e não constituem conselhos ou recomendações financeiras, de investimento, de negociação ou de qualquer outro tipo, fornecidas ou endossadas pela TradingView. Leia mais em Termos de uso.