CHART ANALYSIS & BIAS
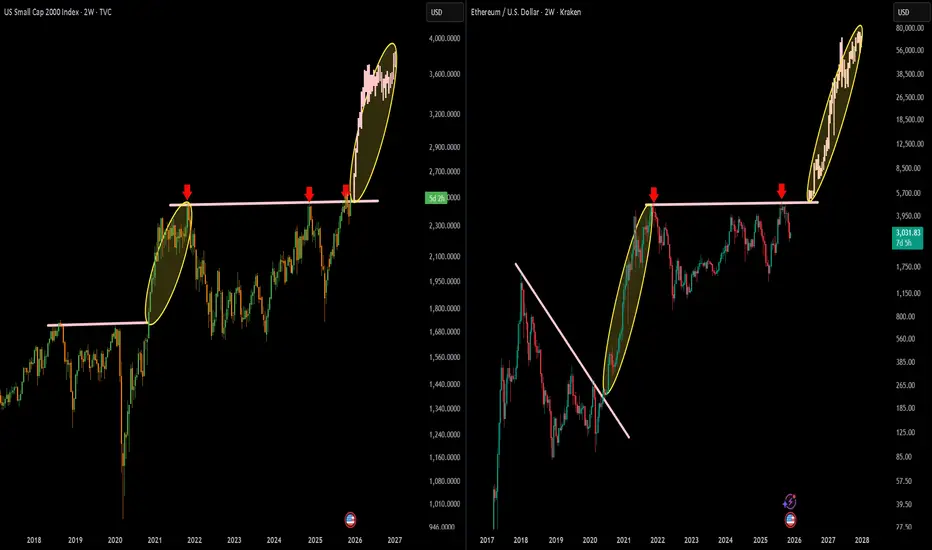
I am comparing US Small Caps (Russell 2000) on the left with Ethereum (ETH) on the right.
Both charts show identical structural behavior:
A long multi-year accumulation / resistance zone
A clean breakout
A vertical markup phase immediately after reclaiming the key level
Strong momentum continuation inside the yellow ellipse
My comparison highlights that ETH tends to follow macro-risk assets, especially small caps, during high-liquidity phases.
📈 LEFT CHART – RUSSELL 2000 (Small Caps)
Key Observations:
Multi-year resistance around 2,350–2,400 (pink line) rejected price multiple times.
When broken in 2020–2021, price exploded +41.79% (highlighted region).
Current breakout (2025) is replicating the same behavior:
Strong impulse
Consecutive bullish candles
No meaningful retracement yet
Risk-on money rotating back into small caps
Macro Implication
Small caps pump when liquidity returns → very bullish signal for crypto.
📈 RIGHT CHART – ETHEREUM (ETH/USD)
Key Observations:
Clean downtrend break in 2020 triggered a +2,264% mega rally (your highlighted zone).
ETH is now doing the same pattern:
Broke a multi-year neckline around $3,950–$4,000
Strong breakout continuation
Vertical markup phase identical to 2020 run
Market Structure
ETH is:
✔ In price discovery mode
✔ Above all major resistances
✔ Showing strong momentum after multi-year accumulation
✔ Mirroring small-cap breakout behavior
📌 FINAL BIAS (COMBINED MACRO + TECHNICAL)
🔥 My Bias is STRONGLY BULLISH for ETH (and crypto overall).
Why?
Macro liquidity rotation → small caps leading = historically extremely positive for crypto.
ETH repeating its 2020 breakout structure → identical vertical markup formation.
Multi-year resistance reclaimed → ETH enters the expansion phase of bullish cycle.
No real resistance above until $7k–$8k based on structure.
Confluence between traditional risk assets & ETH confirms the breakout strength.
🎯 Short-Term Bias (Next Weeks)
Bullish continuation
Possible shallow pullbacks but structure is aggressively upward
Targets: $4,800 → $5,700 → $7,000
🎯 Mid-Term Bias (Cycle Outlook)
ETH mirrors its previous cycle: strong markup phase
Potential targets: $10,000–$14,000 within cycle expansion
Aviso legal
As informações e publicações não se destinam a ser, e não constituem, conselhos ou recomendações financeiras, de investimento, comerciais ou de outro tipo fornecidos ou endossados pela TradingView. Leia mais nos Termos de Uso.
Aviso legal
As informações e publicações não se destinam a ser, e não constituem, conselhos ou recomendações financeiras, de investimento, comerciais ou de outro tipo fornecidos ou endossados pela TradingView. Leia mais nos Termos de Uso.