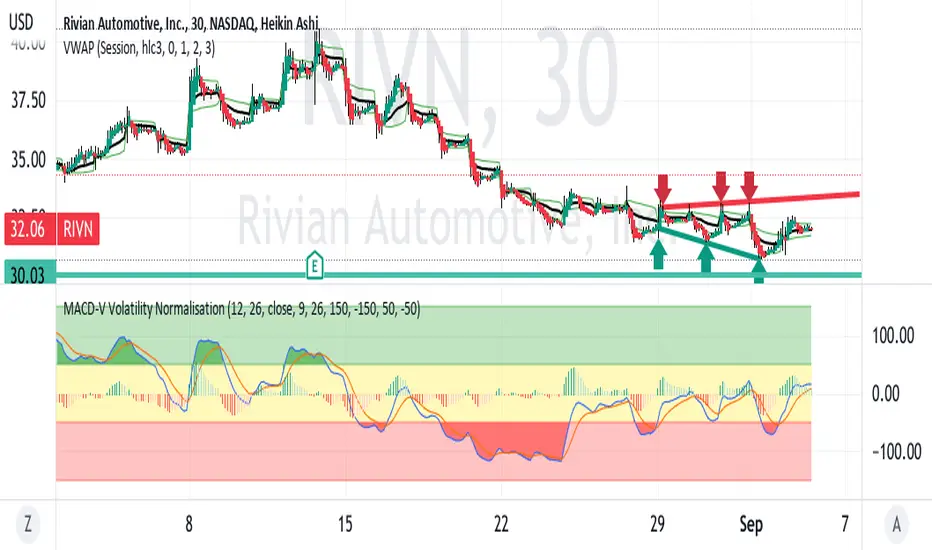
RIVN is in a slow down trending pattern right now within a megaphone
reflecting increasing volatility. The MACD shows the downward momentum
with more of the histogram negative below the zero level.
At present, the K / D lines are crossing over and above the histogram.
characteristic of a reversal to the downside.
Based on pivots in June and July, the horizontal support is at ~ $30.
Accordingly, a target on a short trade setup is just before $30.
This appears to be a good short trade setup where Rivian is
following the downtrend of the sector leader TSLA.
Aviso legal
As informações e publicações não se destinam a ser, e não constituem, conselhos ou recomendações financeiras, de investimento, comerciais ou de outro tipo fornecidos ou endossados pela TradingView. Leia mais nos Termos de Uso.
Aviso legal
As informações e publicações não se destinam a ser, e não constituem, conselhos ou recomendações financeiras, de investimento, comerciais ou de outro tipo fornecidos ou endossados pela TradingView. Leia mais nos Termos de Uso.