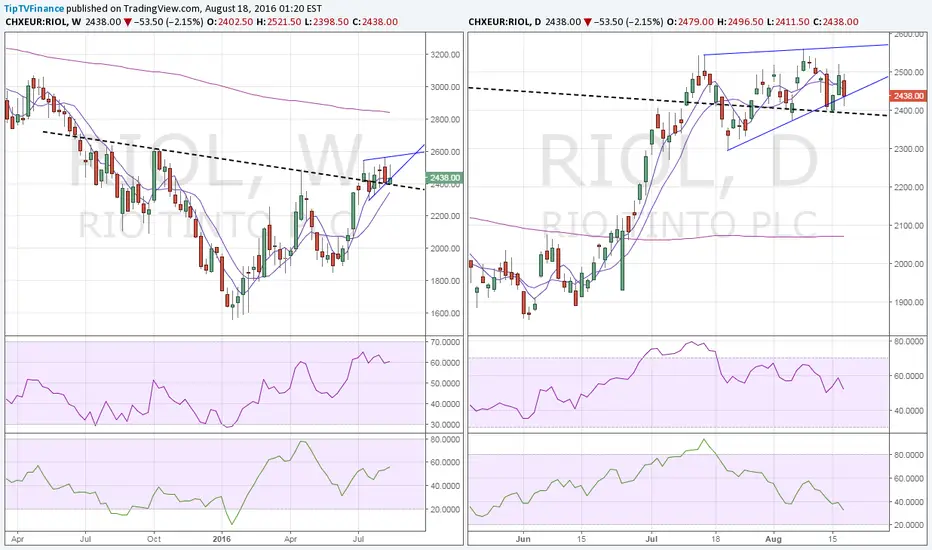
Rio Tinto weekly chart shows inverse head and shoulder breakout, although subsequent rise has been capped repeatedly around 2550 levels.
On the daily chart, both the RSI and money flow index suggest increasing bearish pressure on prices.
Hence, we could a minor drop to 2390-2350 area.
However, overall view stays bullish unless the weekly close is below neckline support level.
On the daily chart, both the RSI and money flow index suggest increasing bearish pressure on prices.
Hence, we could a minor drop to 2390-2350 area.
However, overall view stays bullish unless the weekly close is below neckline support level.
Publicações relacionadas
Aviso legal
As informações e publicações não devem ser e não constituem conselhos ou recomendações financeiras, de investimento, de negociação ou de qualquer outro tipo, fornecidas ou endossadas pela TradingView. Leia mais em Termos de uso.
Publicações relacionadas
Aviso legal
As informações e publicações não devem ser e não constituem conselhos ou recomendações financeiras, de investimento, de negociação ou de qualquer outro tipo, fornecidas ou endossadas pela TradingView. Leia mais em Termos de uso.