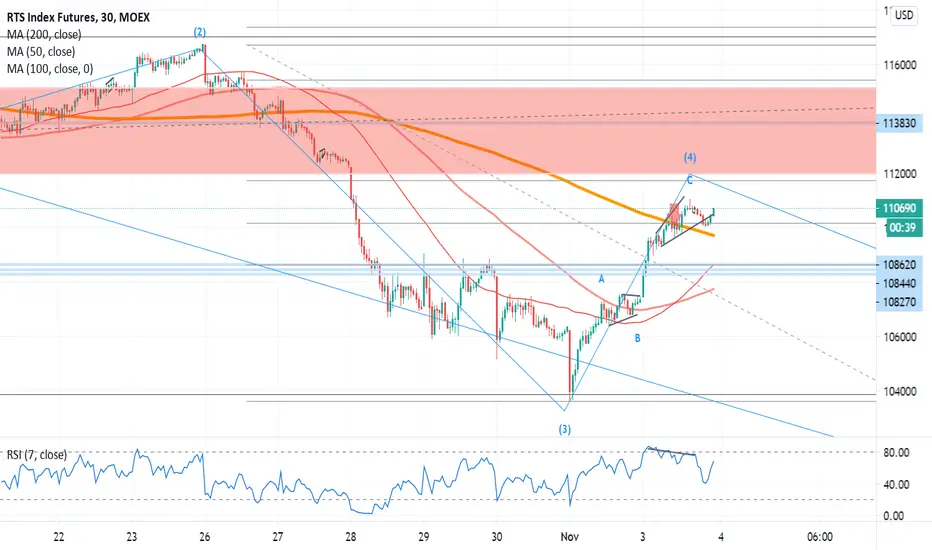
It looks like RTS has just completed wave 4 (before US ballot results announcement) with a simple ABC, with wave 5 of C coming out as an expanding diagonal confirmed by RSI divergence. This is a perfect setup. The timeframe is a bit too low but hey looks good. The tip of the wave 4 is marked with bearish candles on every timeframe starting from 1 min to Daily.
➡️t.me/charta_energeia — regular Elliott Wave and trend analysis on Oil, Gas, and Crypto.
Aviso legal
As informações e publicações não se destinam a ser, e não constituem, conselhos ou recomendações financeiras, de investimento, comerciais ou de outro tipo fornecidos ou endossados pela TradingView. Leia mais nos Termos de Uso.