📊 Intraday Price Movement
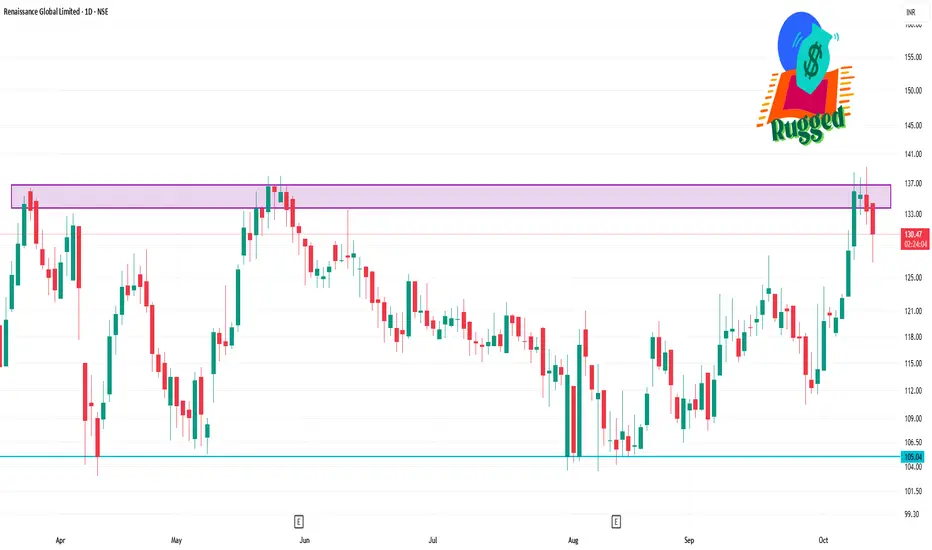
Opening Price: ₹135.00
Day's Range: ₹131.60 – ₹139.21
Previous Close: ₹135.46
Volume Traded: Approximately 711,000 shares
Market Cap: ₹1,453.32 crore
🔧 Technical Indicators
Relative Strength Index (RSI): 72.25, indicating potential overbought conditions
Moving Average Convergence Divergence (MACD): 0.82, suggesting a bullish trend.
Support Levels: ₹130.00 and ₹131.60
Resistance Levels: ₹135.46 and ₹139.21
📈 52-Week Range
High: ₹207.40
Low: ₹103.01
Publicações relacionadas
Aviso legal
As informações e publicações não se destinam a ser, e não constituem, conselhos ou recomendações financeiras, de investimento, comerciais ou de outro tipo fornecidos ou endossados pela TradingView. Leia mais nos Termos de Uso.
Publicações relacionadas
Aviso legal
As informações e publicações não se destinam a ser, e não constituem, conselhos ou recomendações financeiras, de investimento, comerciais ou de outro tipo fornecidos ou endossados pela TradingView. Leia mais nos Termos de Uso.