Viés de baixa
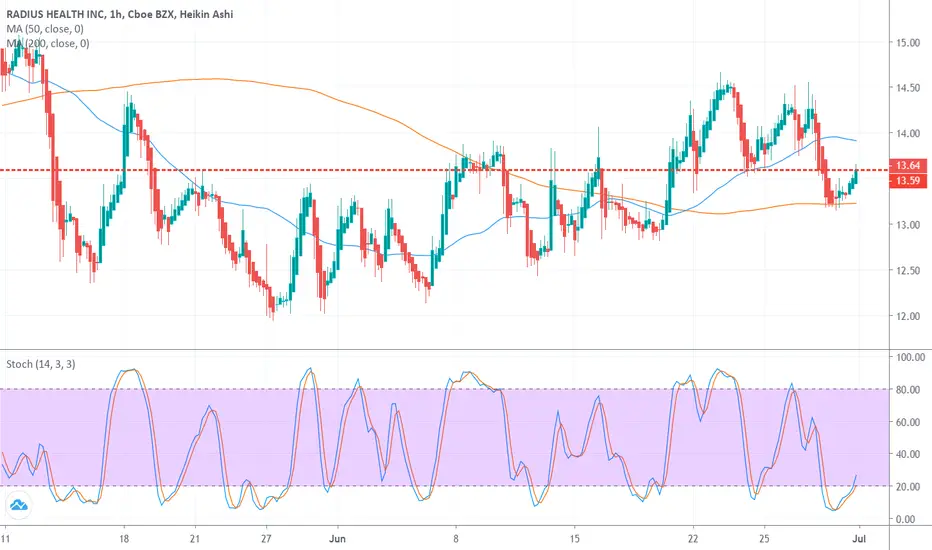
RDUS Stochastic Oscillator left the overbought zone on June 29

Tickeron AI shows that this is a signal that RDUS's price trend could be reversing, and it may be an opportunity to sell the stock or take a defensive position. Tickeron A.I.dvisor identified 62 similar cases where RDUS's stochastic oscillator exited the overbought zone, and 56 of them led to successful outcomes. Odds of Success: 90%.
The price moved below its 50-day Moving Average, which indicates a reversal from an Uptrend to a Downtrend. In 42 of 52 cases where RDUS's price crossed below its 50-day Moving Average, its price fell further within the subsequent month. The odds of a continued Downtrend are 81%.
The price moved below its 50-day Moving Average, which indicates a reversal from an Uptrend to a Downtrend. In 42 of 52 cases where RDUS's price crossed below its 50-day Moving Average, its price fell further within the subsequent month. The odds of a continued Downtrend are 81%.
Aviso legal
As informações e publicações não devem ser e não constituem conselhos ou recomendações financeiras, de investimento, de negociação ou de qualquer outro tipo, fornecidas ou endossadas pela TradingView. Leia mais em Termos de uso.
Aviso legal
As informações e publicações não devem ser e não constituem conselhos ou recomendações financeiras, de investimento, de negociação ou de qualquer outro tipo, fornecidas ou endossadas pela TradingView. Leia mais em Termos de uso.