✅ Current technicals
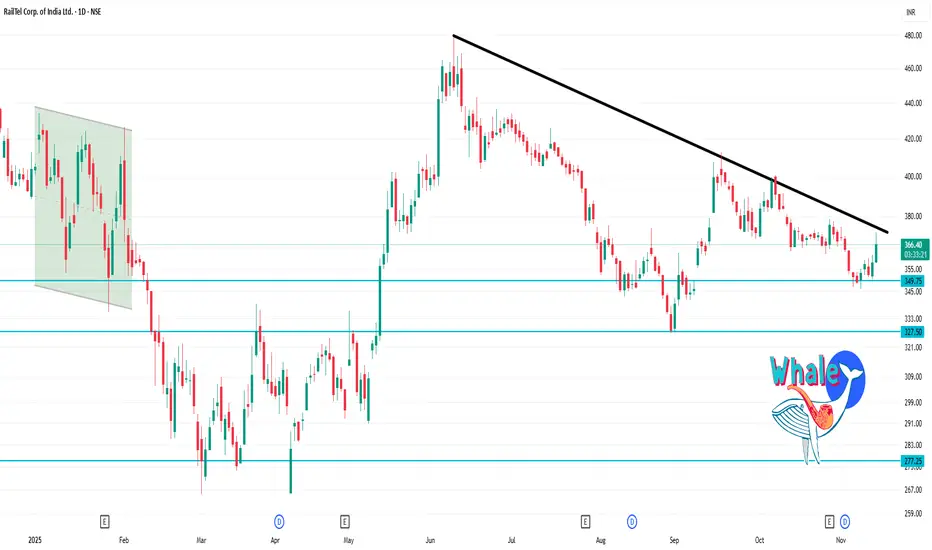
On the daily chart, the stock is near ~ ₹365.70 .
RSI(14) is ~ 63.7 → moderate momentum.
Many moving averages (20/50) are showing “buy” signals, but the 200-day is still above current price, giving a mixed picture.
Trend strength (ADX) is relatively weak/neutral, suggesting the move is not strongly trending.
🎯 Key levels (1-day timeframe)
These are approximate support/resistance and pivot levels derived from recent data.
Pivot & immediate levels
Pivot (classic) ~ ₹368.53.
Resistance 1 (R1) ~ ₹370.66.
Resistance 2 (R2) ~ ₹374.33.
Support 1 (S1) ~ ₹364.86.
Support 2 (S2) ~ ₹362.73.
Wider/more conservative zones
Major longer-term support: ~ ₹351–355 zone (from older pivot S2/S3).
Major longer‐term resistance: ~ ₹374–380 zone.
Publicações relacionadas
Aviso legal
As informações e publicações não se destinam a ser, e não constituem, conselhos ou recomendações financeiras, de investimento, comerciais ou de outro tipo fornecidos ou endossados pela TradingView. Leia mais nos Termos de Uso.
Publicações relacionadas
Aviso legal
As informações e publicações não se destinam a ser, e não constituem, conselhos ou recomendações financeiras, de investimento, comerciais ou de outro tipo fornecidos ou endossados pela TradingView. Leia mais nos Termos de Uso.