1-Day Chart:
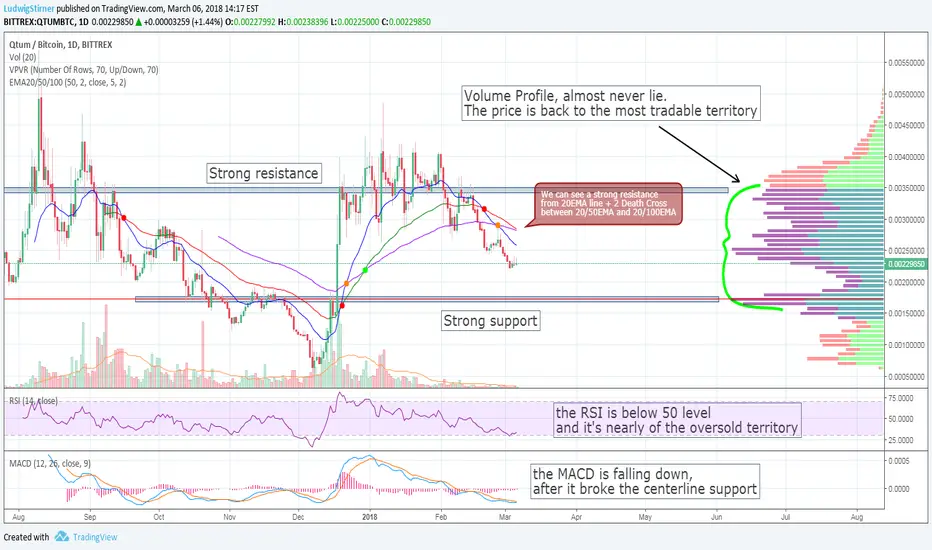
QTUM seems to love the downtrend so much and I suppose on the daily chart, the price will fall lower to the support level at the 0.0018 area. It will act as support on the downway.
RSI is below 50 indicating a downtrend. The MACD is falling down, giving a sell sign. Clearly, QTUM isn't oversold on traditional technical measures such as RSI, MACD, and Moving Averages and more, so that is one warning flag.
The falling trend that has been support since the rally started in Feburary continues to hold indicating the market rally will continue. However, volume is below average, a sign that the downtrend can continue.
4-Hour Chart:

We fell into a bear market as the price dropped below 0.0033 area. The price fell through the rising ex-support level and the 100EMA and MACD crossed below zero.
Conclusion: I will wait the support level to decide when the best time to open a long position.
QTUM seems to love the downtrend so much and I suppose on the daily chart, the price will fall lower to the support level at the 0.0018 area. It will act as support on the downway.
RSI is below 50 indicating a downtrend. The MACD is falling down, giving a sell sign. Clearly, QTUM isn't oversold on traditional technical measures such as RSI, MACD, and Moving Averages and more, so that is one warning flag.
The falling trend that has been support since the rally started in Feburary continues to hold indicating the market rally will continue. However, volume is below average, a sign that the downtrend can continue.
4-Hour Chart:
We fell into a bear market as the price dropped below 0.0033 area. The price fell through the rising ex-support level and the 100EMA and MACD crossed below zero.
Conclusion: I will wait the support level to decide when the best time to open a long position.
Aviso legal
As informações e publicações não devem ser e não constituem conselhos ou recomendações financeiras, de investimento, de negociação ou de qualquer outro tipo, fornecidas ou endossadas pela TradingView. Leia mais em Termos de uso.
Aviso legal
As informações e publicações não devem ser e não constituem conselhos ou recomendações financeiras, de investimento, de negociação ou de qualquer outro tipo, fornecidas ou endossadas pela TradingView. Leia mais em Termos de uso.