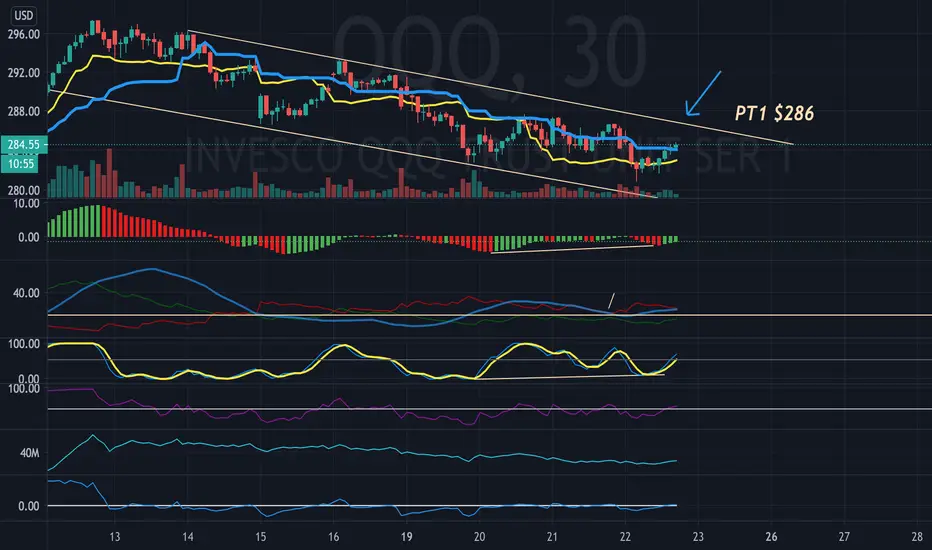
30 min chart showing bullish divergence for RSI and STOC.
60 min chart has a possible pin bar.
Overall trend is still down on 4 hour chart until 286 is broken to the upside decisively.
1st price target 286. then will probably fail at the top channel line and continue bearish trend.
PT1 286
PT 2 269
Disclaimer, this is only for entertainment and education purposes and doesn't serve by any means as a buy or sell recommendation.
Personally I hold both long term long positions and occasionally short term short position, for disclosure purpose.
Aviso legal
As informações e publicações não devem ser e não constituem conselhos ou recomendações financeiras, de investimento, de negociação ou de qualquer outro tipo, fornecidas ou endossadas pela TradingView. Leia mais em Termos de uso.
Aviso legal
As informações e publicações não devem ser e não constituem conselhos ou recomendações financeiras, de investimento, de negociação ou de qualquer outro tipo, fornecidas ou endossadas pela TradingView. Leia mais em Termos de uso.