Positional setup for Quality Power Electrical Equipments Ltd. (Q
Technical Analysis (Daily Chart)
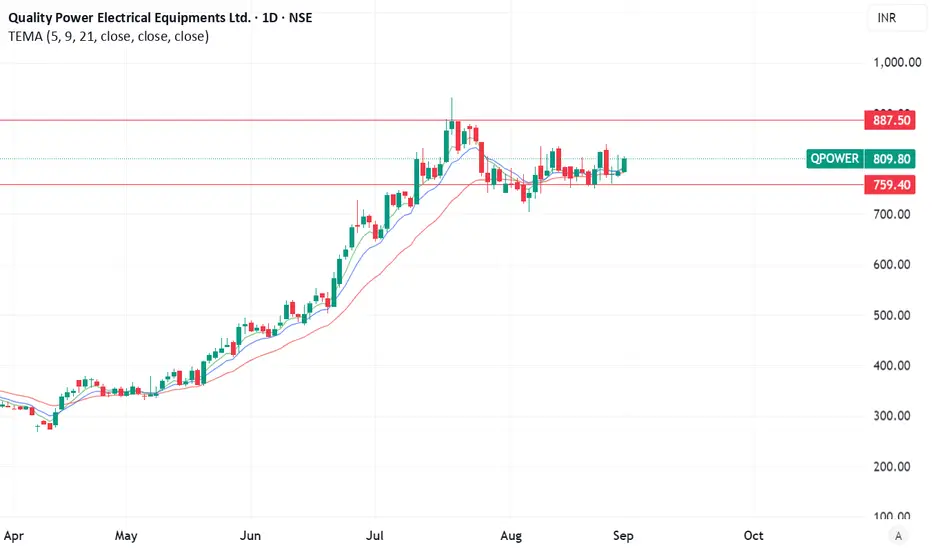
Trend Structure: The stock is riding a steady uptrend, with price comfortably above the 5-, 9-, and 21-period EMAs—signaling robust momentum.
Consolidation Base: A plateau formed around ₹780–820, anchoring a clear base from which a potential breakout may emerge.
Key Levels:
Entry: Buy near breakout above ₹820–825 with confirmation (volume and candle).
Support Zone: ₹790–800—acts as a protective buffer.
Target 1: ₹880–890 (recent swing high).
Target 2: ₹950+ if momentum sustains post-breakout.
Fundamentals Overview
Sourced from Screener, SimplyWall, StockAnalysis, ICICI Direct, and others:
Valuation & Returns:
P/E ≈ 91× — high vs industry average (~44×)
P/B ≈ 13×–14×
ROE ≈ 42%, ROCE ≈ 41–42%
Screener
Value Research Online
ICICI Direct
Profitability & Cash:
Recent quarterly revenues up to ₹177 Cr; net profits ~₹37 Cr
Screener
Sharescart
Profit margins strong: Gross ~38%, Operating ~15%, Net ~13%
StockAnalysis
Net cash position: ₹244 Cr cash vs ₹9 Cr debt → Net cash ~₹235 Cr (≈ ₹30/share)
StockAnalysis
Growth & Balance Sheet:
1-Year Sales & PAT CAGRs: ~19% & 38% respectively
Sharescart
Value Research Online
Market cap ~₹6,000 Cr; low gearing (~0.2–0.25) levered for strength
Screener
Value Research Online
Sharescart
StockAnalysis
Summary Table
Parameter Details
Entry Zone ₹820–825 (on strong breakout)
Stop-Loss ₹790–800 (below consolidation support)
Target Levels ₹880–890 → ₹950+
Valuation P/E ~91×, P/B ~13× → expensive territory
Profitability ROE ~42%, ROCE ~42%
Cash Position Strong net cash (~₹235 Cr)
Growth Strong recent growth; track record
Aviso legal
As informações e publicações não devem ser e não constituem conselhos ou recomendações financeiras, de investimento, de negociação ou de qualquer outro tipo, fornecidas ou endossadas pela TradingView. Leia mais em Termos de uso.
Aviso legal
As informações e publicações não devem ser e não constituem conselhos ou recomendações financeiras, de investimento, de negociação ou de qualquer outro tipo, fornecidas ou endossadas pela TradingView. Leia mais em Termos de uso.